Logs and alerting in OxiDB: GELF, MessagePack, retention and webhooks
OxiDB's log engine: GELF and MessagePack ingestion over UDP, chunk reassembly, dynamic per-field indexing, per-collection retention, threshold alerts with webhooks, and oxidb-tail. Tested with real packets, defects included.
The first thing you need once an application is in production is its logs. The second is something that tells you when those logs say something has gone wrong. The usual answer is a separate stack: Graylog or Elasticsearch, a shipper in front, an alerting service on the side. In OxiDB I made the database do that job itself. The server accepts GELF (Graylog Extended Log Format) and MessagePack log records over UDP, writes them into ordinary document collections, applies a retention period per collection, and evaluates threshold alerts in the background that call a webhook. In this post I show how that engine works by sending real packets to a real server, and I am also writing down, without hiding them, the defects I found while doing it.
This is the ninth post in the OxiDB series. Everything here is built on the document engine: logs are documents, the indexes are the document engine's indexes, and retention is its TTL machinery.
Why put logs in the database?
In a small or medium system, the logging infrastructure often needs more care than the application. An Elasticsearch cluster, its heap settings, index templates, retention policies, a separate alerting tool... OxiDB already stores documents, indexes them, queries them and expires them with TTL. A log line is just a timestamped, structured document. The missing pieces were:
- receiving logs over a cheap network protocol (UDP, GELF, MessagePack),
- writing a high rate of small records in batches,
- retention per collection,
- alerts of the "call a webhook if there were more than 100 errors in the last 5 minutes" kind,
- a tool to watch it live in a terminal (oxidb-tail).
All in one process. No extra service.
Enabling it
Each input is switched on by an environment variable. This is the command I used for the experiments (the ports are the ones I picked for this post, not defaults):
OXIDB_ADDR=127.0.0.1:15900 \
OXIDB_DATA=./data \
OXIDB_GELF_PORT=15908 \
OXIDB_MSGPACK_PORT=15909 \
OXIDB_UDP_PORT=15910 \
OXIDB_ALERT_INTERVAL=2 \
./oxidb-server
The server says exactly what it is doing at startup:
TTL eviction: enabled (interval=1000ms)
alert evaluator: enabled (interval=2s)
oxidb-server listening on 127.0.0.1:15900 (pool_size=4, data_dir=.../data, idle_timeout=0s)
UDP log ingestion: listening on 0.0.0.0:15910 → collection '_udp_logs' (8 threads)
GELF ingestion: listening on 0.0.0.0:15908 → collection '_gelf_logs' (8 receivers, 4 writers, batch=2000, simd-json, crossbeam, auto-indexing)
MessagePack ingestion: listening on 0.0.0.0:15909 → collection '_msgpack_logs' (8 receivers, 4 writers, batch=2000, no auto-indexing)
The full set of variables:
| Variable | Default | What it does |
|---|---|---|
OXIDB_GELF_PORT | off | GELF UDP listener |
OXIDB_GELF_COLLECTION | _gelf_logs | Collection GELF records go to |
OXIDB_MSGPACK_PORT | off | MessagePack UDP listener |
OXIDB_MSGPACK_COLLECTION | _msgpack_logs | MessagePack collection |
OXIDB_MSGPACK_TTL_SECS | 604800 (7 days) | TTL of the MessagePack collection, 0 keeps everything |
OXIDB_UDP_PORT | off | Raw UDP listener (JSON or plain text) |
OXIDB_UDP_COLLECTION | _udp_logs | Raw UDP collection |
OXIDB_ALERT_INTERVAL | 15 seconds | Alert evaluation interval |
OXIDB_GELF_ADDR | off | GELF target for the server's own logs |
OXIDB_MSGPACK_ADDR | off | MessagePack target for the server's own REST request log |
One note: all three UDP listeners bind to 0.0.0.0 regardless of OXIDB_ADDR, as the output above shows. UDP has no authentication, so keep these ports behind a firewall.
A question I wanted to settle was whether OXIDB_UDP_PORT is a separate input. It is: it lives in udp_ingest.rs, independent of GELF, and it is the plainest of the three. I cover it below.
Inside the engine: the big picture
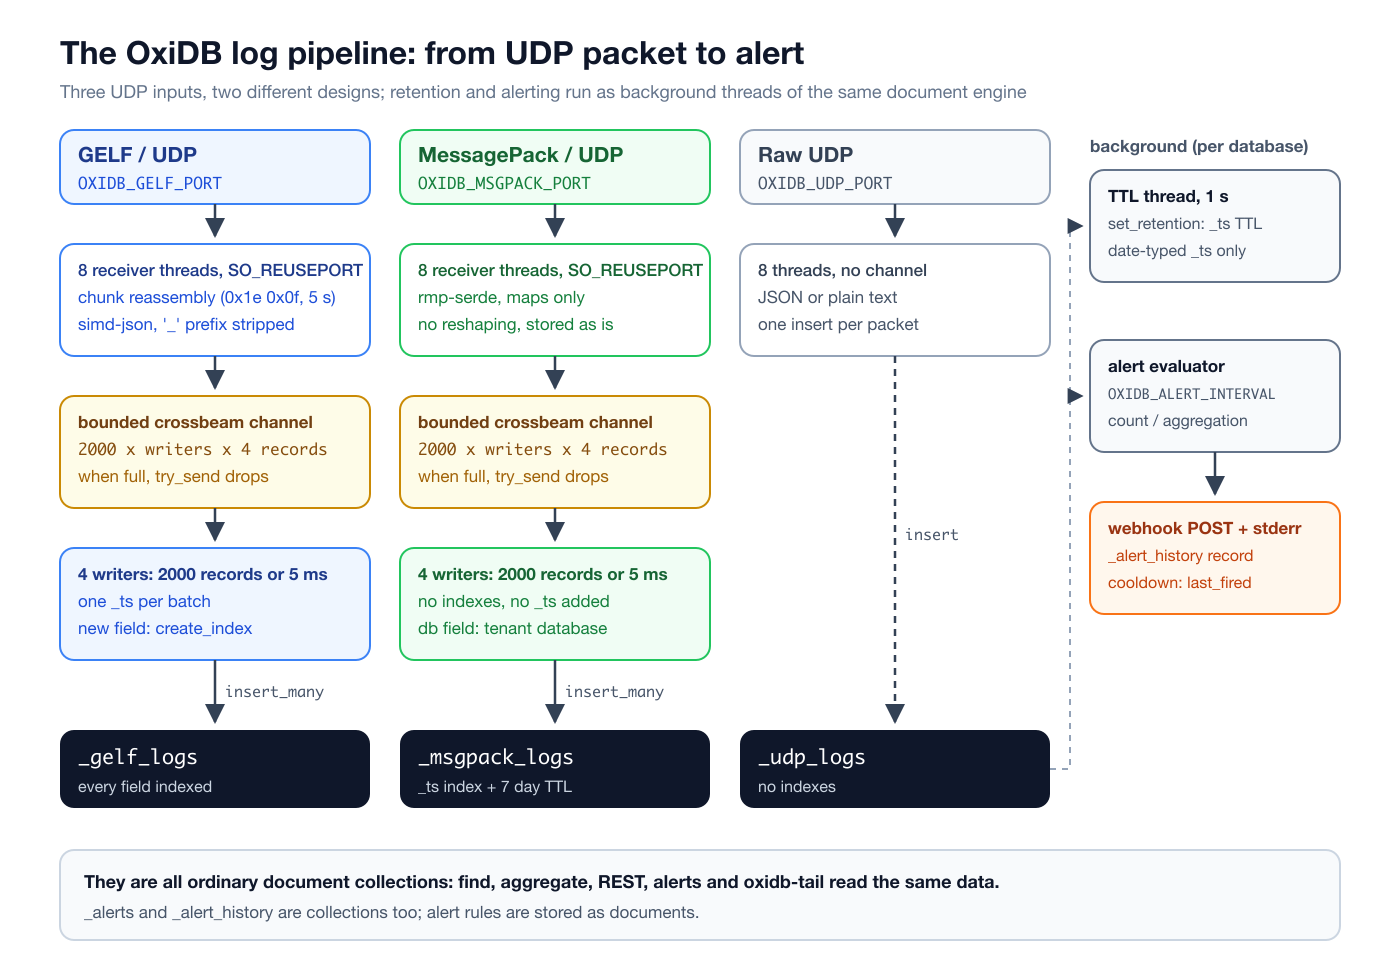
All three inputs are variations of one skeleton:
- Receiver threads. As many threads as there are cores, capped at 8, bind the same UDP port with
SO_REUSEPORT. The kernel spreads incoming packets across these sockets, so a singlerecvloop is never the bottleneck. Each socket asks for a 64 MB receive buffer (8 MB for raw UDP). - A bounded channel. For GELF and MessagePack, receivers push decoded documents into a lock-free
crossbeamchannel. Its capacity is2000 x writers x 4. My 10-core machine had 4 writers, so 32,000 records. - Writer threads. Half as many writers as receivers (at least 2) pull from the channel. A writer closes a batch when it reaches 2000 records or 5 ms after its first record, whichever comes first, and writes it with a single
insert_many. - The collection. The result is an ordinary document collection. WAL, fsync, indexes, queries: all of it is the document engine.
The point of this design is the batch. A 2000-record insert_many instead of individual inserts spreads the cost of the collection lock, the WAL write and the fsync over hundreds of records. The 5 ms cap stops a record from waiting forever when traffic is low.
GELF: receiving Graylog-format logs
GELF is Graylog's JSON log format. In version 1.1 the required fields are version, host and short_message. There are optional fields full_message, timestamp, level (syslog levels, 0 emergency to 7 debug), and as many additional fields starting with _ as you like. GELF loggers exist for most languages, so swapping a Graylog endpoint for OxiDB is just an address change on the application side.
OxiDB transforms each message like this:
- No
short_message, and the message is silently dropped. - The standard fields (
host,short_message,full_message,timestamp,level,facility) are kept as they are. versionis removed.- The leading underscore of additional fields is stripped:
_useris stored asuser. - Before writing a batch, the writer thread adds
_tsto every document. Note that this stamp is taken once per batch, not per message. Every record that falls into the same 5 ms window carries the same_ts. That is deliberate: even the clock call happens once per 2000 records. If you want the message's own time, GELF'stimestampfield is stored too.
JSON is parsed in place with simd-json.
Sending real messages
Without any library, using a plain Python socket, I sent three normal messages and one chunked one:
import socket, json, os, time
sock = socket.socket(socket.AF_INET, socket.SOCK_DGRAM)
dst = ("127.0.0.1", 15908)
def send(msg):
    sock.sendto(json.dumps(msg).encode(), dst)

send({"version":"1.1","host":"api-01","short_message":"Login user: baris","level":6,
      "facility":"auth","timestamp":time.time(),"_user":"baris","_client_ip":"192.0.2.10","_latency_ms":42})
send({"version":"1.1","host":"api-02","short_message":"Payment declined","level":3,
      "facility":"billing","timestamp":time.time(),"_user":"ayse","_order_id":54321,"_amount":2500.0})
send({"version":"1.1","host":"worker-1","short_message":"Retrying job SendEmail","level":4,
      "facility":"jobs","timestamp":time.time(),"_job":"SendEmail","_attempt":3})

# a ~23 KB message split into 8 KB chunks and sent in REVERSE order
full = "Traceback (most recent call last):\n" + "".join(f"  at frame_{i} (service.rs:{i})\n" for i in range(700))
big = json.dumps({"version":"1.1","host":"api-01","short_message":"Unhandled panic in /checkout",
      "full_message":full,"level":2,"facility":"checkout","_request_id":"req-7f3a"}).encode()
CH = 8192
parts = [big[i:i+CH] for i in range(0, len(big), CH)]
mid = os.urandom(8)
order = list(range(len(parts)))[::-1]
for seq in order:
    sock.sendto(b"\x1e\x0f" + mid + bytes([seq, len(parts)]) + parts[seq], dst)
print(f"chunked payload: {len(big)} bytes -> {len(parts)} chunks, sent in order {order}")
chunked payload: 23084 bytes -> 3 chunks, sent in order [2, 1, 0]The server's stderr shows an index being created for every field it sees for the first time:
GELF auto-index: created index on 'job' in '_gelf_logs'
GELF auto-index: created index on 'attempt' in '_gelf_logs'
GELF auto-index: created index on 'amount' in '_gelf_logs'
GELF auto-index: created index on 'order_id' in '_gelf_logs'
GELF auto-index: created index on 'client_ip' in '_gelf_logs'
GELF auto-index: created index on 'user' in '_gelf_logs'
GELF auto-index: created index on 'latency_ms' in '_gelf_logs'
GELF auto-index: created index on 'request_id' in '_gelf_logs'
GELF auto-index: created index on 'full_message' in '_gelf_logs'
Querying
OxiDB's wire protocol is length-prefixed JSON (a 4-byte little-endian length followed by JSON). The requests and responses below are real messages over that protocol. First, a count:
{"cmd": "count", "collection": "_gelf_logs", "query": {}}{"ok": true, "data": {"count": 4}}Four records: three normal messages and one reassembled from three chunks. Now a range query on an additional field. The latency_ms index was created automatically, so this query uses it:
{"cmd": "find", "collection": "_gelf_logs", "query": {"latency_ms": {"$gt": 10}}}{
"ok": true,
"data": [
{
"host": "api-01",
"short_message": "Login user: baris",
"timestamp": 1791754331.033758,
"level": 6,
"facility": "auth",
"user": "baris",
"latency_ms": 42,
"client_ip": "192.0.2.10",
"_ts": "2026-10-11T21:32:11.039911+00:00",
"_id": 2,
"_version": 1
}
]
}_user became user, there is no version, and _ts was added. A level <= 3 query returned the "Payment declined" record and the chunked message, and both had exactly _ts: 2026-10-11T21:32:11.039911+00:00. All four messages landed in the same batch, so they got the same stamp. I also checked that the chunked message came back intact:
chunked doc: short_message='Unhandled panic in /checkout', full_message 22215 chars, 701 lines, last line ' at frame_699 (service.rs:699)'The last line of the 700-line stack trace is where it should be. The collection's index list:
indexes: ['_ts', 'amount', 'attempt', 'client_ip', 'facility', 'full_message', 'host', 'job', 'latency_ms', 'level', 'order_id', 'request_id', 'short_message', 'timestamp', 'user']Chunked message reassembly
UDP datagrams are limited to a few kilobytes in practice, so GELF splits large messages into chunks. Each chunk starts with a 12-byte header: 2 magic bytes (0x1e 0x0f), an 8-byte message id, a 1-byte sequence number and a 1-byte chunk count.
In OxiDB every receiver thread keeps its own HashMap<message_id, ChunkBuffer>. Chunks go into the slot given by their sequence number; a repeated sequence number is ignored (the first one wins). When the last missing chunk arrives, the chunks are concatenated in order and parsed. In the example above I sent the chunks in reverse on purpose, and it made no difference. Incomplete messages are discarded after 5 seconds. That sweep runs every 1000 packets, so on an idle server a half-finished buffer can live a little longer.
One subtle aspect: buffers are per thread. SO_REUSEPORT distributes by source address and port, so chunks sent from the same socket land on the same thread. A client that sent the chunks of one message from different source ports could have them spread across threads, and the message would never be reassembled. The GELF libraries I know send a message from one socket, but the limit is worth knowing.
Elasticsearch-style dynamic indexing
This is the defining feature of the GELF input: every field is indexed the moment it is first seen. Indexes on host, short_message, level, facility, timestamp and _ts are created at startup. After that, each writer collects the field names in its batch and compares them with the set of known fields; if there is an unknown one, it calls create_index. The known-field set sits behind a shared mutex, and the fast path is just a set membership check.
The benefit is obvious: if your application starts sending a new _tenant_id field tomorrow, a {"tenant_id": "acme"} query runs on an index with no schema or index setup at all. Elasticsearch's dynamic mapping does the same, and for logs it really is convenient.
The cost is just as obvious:
- Every field is a B-tree index. The four messages above produced 15 indexes. That includes the 22 KB
full_message: an entire stack trace becomes an index key. High-cardinality fields (request duration, request id) are the ones that grow index memory and write cost the most. - A new field means an index build on the write path. That has a measurable side effect, covered in the "Measurement" section below.
No compression support
The GELF specification allows UDP messages to be compressed with zlib or gzip. OxiDB's receiver does not decompress. I tried it:
s.sendto(zlib.compress(m("zlib-compressed")), ("127.0.0.1",15908))
s.sendto(gzip.compress(m("gzip-compressed")), ("127.0.0.1",15908))
s.sendto(m("plain"), ("127.0.0.1",15908))
stored: ['plain']The two compressed messages vanished without a trace. Some GELF clients compress over UDP by default, so turn that off when sending to OxiDB.
MessagePack: the cheap sibling that does not index on purpose
The MessagePack input uses the same skeleton as GELF (8 receivers, bounded channel, 4 writers, 2000 records or 5 ms), with two important differences:
- The format is binary and compact. Parsing uses
rmp-serdeand only maps are accepted. There is no reshaping, no stripping of_prefixes: the record is stored as it arrives. - No per-field indexing. On purpose.
The reasoning in the source comes down to this: GELF's dynamic mapping builds a B-tree per field, and high-cardinality fields like request latency dominate memory. A log stream, however, is append-only and rarely queried by an arbitrary field. Most of the time you want "show me the last N records" or "show me this time range", and a single _ts index covers that. When the server starts the MessagePack listener, it puts an index on _ts and a default 7-day TTL on the collection. According to the comment in the code, the goal is that the dashboard's newest-first paging does not turn into a full scan, and that the collection does not grow without bound.
I compared the size of the same records:
GET /api/orders 200    msgpack 124 B vs JSON 169 B
POST /api/pay 502      msgpack 123 B vs JSON 167 B
GET /health 200        msgpack 116 B vs JSON 160 B
Packets about 27 percent smaller. Queries still work, they just run without an index (a full scan):
{"cmd": "find", "collection": "_msgpack_logs", "query": {"status": {"$gte": 500}}}{
"ok": true,
"data": [
{
"host": "edge-1",
"short_message": "POST /api/pay 502",
"level": 3,
"method": "POST",
"path": "/api/pay",
"status": 502,
"dur_ms": 3010,
"ts": 1791754356.749907,
"_ts": 1791754356749,
"_id": 2,
"_version": 1
}
]
}These are the only indexes on the collection:
{"cmd": "list_indexes", "collection": "_msgpack_logs"}{
"ok": true,
"data": [
{"name": "_ts", "index_type": "field", "fields": ["_ts"], "unique": false},
{"name": "_ts_ttl", "index_type": "ttl", "fields": ["_ts"], "unique": false, "expire_after_seconds": 604800}
]
}(I collapsed this response onto fewer lines for readability; the content is unchanged.)
Routing by tenant
The MessagePack input has one more trick: if a record has a db field and a database of that name exists, the record goes to the same-named collection in that database. The writer groups each batch by target database and does one insert_many per group. The reasoning is written in the code: one shared log sink meant that every read of one project's logs walked past every other project's rows, and retention, size and query cost were all shared. A tenant's requests are the tenant's data, and dropping a project takes its logs with it. Records without db (the control plane's own requests) stay in the default database, and a record naming a database that does not exist is not dropped, it goes to the default database too. The first write into a tenant database also sets up the _ts index and TTL there.
Raw UDP: the plainest input
OXIDB_UDP_PORT is the third and simplest input. If a packet parses as JSON it is stored as a document; otherwise it becomes {"message": "...", "_ts": ...}. A packet's own _ts is preserved. It is handy for collecting syslog-like plain-text lines with no transformation at all:
s.sendto(b'{"level":"error","msg":"disk 91% full","mount":"/var"}', ("127.0.0.1", 15910))
s.sendto(b'kernel: eth0 link down\n', ("127.0.0.1", 15910))
{
"ok": true,
"data": [
{
"level": "error",
"msg": "disk 91% full",
"mount": "/var",
"_ts": "2026-10-11T21:32:36.750067+00:00",
"_id": 1,
"_version": 1
},
{
"message": "kernel: eth0 link down",
"_ts": "2026-10-11T21:32:36.753946+00:00",
"_id": 2,
"_version": 1
}
]
}There is no channel and no batching here: each of the 8 threads receives a packet and does a single insert directly. The comment at the top of the file still says "1 writer thread drains the channel in batches", but the code no longer does that. The collection has no indexes at all; list_indexes returned an empty array. For high volume I would pick the GELF or MessagePack inputs; raw UDP is more for "I have nc, let me throw this line somewhere".
Measurement: a 50,000 packet burst
To make the difference between GELF and MessagePack concrete, I sent 50,000 packets as fast as one Python socket could and then counted how many records were written. Setup: Apple M4 (10 cores), local loopback, OxiDB 0.44.2, default disk settings (every commit fsync'd). Sending took 0.16 to 0.24 seconds each time, and all records were queryable within 1.2 seconds at most (my loop counted every 0.5 seconds, so I do not have a finer resolution than that).
GELF         sent 50000 in 0.16s, stored 50000 (100.0%), all visible after 1.17s (incl. 0.5s idle check)
MessagePack  sent 50000 in 0.18s, stored 50000 (100.0%), all visible after 1.19s (incl. 0.5s idle check)
With field names the server had already seen, both inputs were lossless. When I added new field names to the burst, the picture changed:
GELF         sent 50000 in 0.18s, stored 33439 (66.9%), all visible after 1.19s (incl. 0.5s idle check)
MessagePack  sent 50000 in 0.19s, stored 50000 (100.0%), all visible after 1.19s (incl. 0.5s idle check)
GELF         sent 50000 in 0.24s, stored 32751 (65.5%), all visible after 1.24s (incl. 0.5s idle check)
MessagePack  sent 50000 in 0.16s, stored 50000 (100.0%), all visible after 1.17s (incl. 0.5s idle check)
The very first run had shown the same thing (33,595 records). In all three, GELF lost about a third.
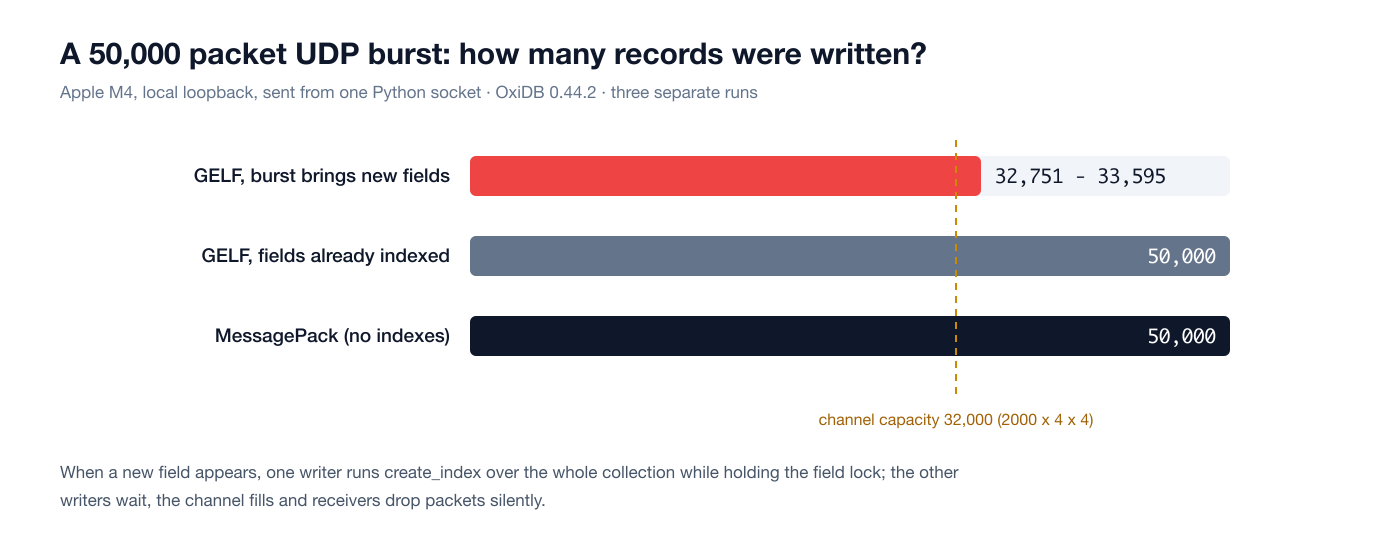
Reading the code, the most likely explanation is this: a writer that sees a new field calls create_index while holding the known-fields mutex. The collection had well over a hundred thousand records at that point, so the index is built over the whole collection. The other three writers check the same mutex on every batch, so they wait. While the writers are stalled, the receivers fill the channel, and once it is full try_send silently drops the packet. The number of records written being so close to the channel capacity (32,000) plus a batch or so fits that explanation. MessagePack has no index builds, so the same burst went through without loss.
This is a deliberate trade-off in the design: UDP has no back-pressure, you cannot tell the sender to slow down, so dropping when the queue is full is better than locking up the server. But the consequence is that, in GELF, the moment a new field first appears is the worst moment. In practice I would suggest two things: for applications with a fixed set of fields, warm up the indexes by sending a few sample messages before the first deployment, or route high-volume, schema-shifting streams to the MessagePack input. There is also no counter for these drops; I want to add one as a metric.
Retention: set_retention and the TTL machinery
Retention is defined per collection:
{"cmd": "set_retention", "collection": "app_logs", "days": 7}What happens inside is simple: set_retention puts a TTL index of days x 86400 seconds on the collection's _ts field and writes the policy as a document into the _retention_policies collection. The deletion itself is done by the document engine's existing TTL thread (once a second in file mode, every 100 ms in memory mode). The TTL sweep is a range scan over the _ts index, "up to expire_after_seconds before now". Deletion happens in chunks of 4096, releasing the index write locks between chunks, so a large backlog of expired records does not lock the collection for a long time.
The test: I wrote four documents with _ts values 0, 3, 8 and 30 days old into an app_logs collection and set a 7-day retention. Expired documents are deleted as soon as the TTL index is created:
{"cmd": "set_retention", "collection": "app_logs", "days": 7}{"ok": true, "data": "retention set: app_logs (7 days)"}{"cmd": "find", "collection": "app_logs", "query": {}}{
"ok": true,
"data": [
{"short_message": "0 days old", "_ts": "2026-10-11T21:33:01.272662+00:00", "_id": 1, "_version": 1},
{"short_message": "3 days old", "_ts": "2026-10-08T21:33:01.272662+00:00", "_id": 2, "_version": 1}
]
}(Again collapsed onto fewer lines.) The 8 and 30 day old documents are gone. The policy document:
{"cmd": "get_retention", "collection": "app_logs"}{
"ok": true,
"data": {
"collection": "app_logs",
"retain_days": 7,
"expire_after_seconds": 604800,
"_ts": "2026-10-11T21:33:01.348133+00:00",
"_id": 1,
"_version": 1
}
}days: 0 is rejected (retain_days must be > 0). delete_retention removes the TTL setting but keeps the _ts field index, and list_retentions lists all policies.
What I like about this approach is that I did not write a new mechanism: log retention is one way of using the document engine's TTL index. That is also where it differs from retention in the time series engine: there, sealed blocks are dropped whole; here, documents are deleted one by one through the index. Fine for logs, but on very large collections not as cheap as dropping blocks.
Two defects I found while testing
Changing the retention period does not change the TTL. create_ttl_index does nothing if a TTL already exists on that field (it is idempotent). set_retention updates the policy document but does not rebuild the TTL:
policy record retain_days: 30
ttl index: [{'name': '_ts_ttl', 'index_type': 'ttl', 'fields': ['_ts'], 'unique': False, 'expire_after_seconds': 604800}]
The policy says 30 days, but the TTL that actually deletes is still 7 days (604800 seconds). The workaround is delete_retention first, then set_retention again:
after delete: [('_ts', 'field')]
after re-set to 30: [{'name': '_ts_ttl', 'index_type': 'ttl', 'fields': ['_ts'], 'unique': False, 'expire_after_seconds': 2592000}]
Numeric _ts values are never deleted. The TTL sweep only looks at date-typed index values. The code explains why: if the lower bound of the range were unbounded, every document carrying a numeric created_at field would be deleted regardless of its expiry. In OxiDB a string in ISO 8601 / RFC 3339 form is stored in the index as a date, and a number as a number. But the server's own MsgpackLogger writes _ts as epoch milliseconds, that is, as a number. I tested it: I sent three records dated 10 days ago to the MessagePack input, one with an epoch-ms _ts, one with an ISO string _ts, and one without _ts. Then I waited a few seconds for the default 7-day TTL to run:
{"cmd": "find", "collection": "_msgpack_logs", "query": {"short_message": {"$in": ["old, epoch-ms _ts", "old, ISO-8601 _ts", "no _ts at all"]}}}{
"ok": true,
"data": [
{"short_message": "no _ts at all", "_id": 5, "_version": 1},
{"short_message": "old, epoch-ms _ts", "_ts": 1790890365335, "_id": 4, "_version": 1}
]
}Only the ISO string one was deleted. So in 0.44.2 the default 7-day TTL on _msgpack_logs never deletes records with a numeric _ts, such as OxiDB's own REST request log, and the MessagePack input does not stamp records that have no _ts either. If you send MessagePack from your own application, write _ts as an ISO 8601 string. The work on my side is clear too: either extend the TTL sweep to cover numeric epoch-ms values behind an explicit option, or make the logger and the input write _ts as a date.
Alerts
Alert rules are documents in the _alerts collection. In the background, an oxidb-alerts thread per database wakes up every OXIDB_ALERT_INTERVAL seconds, reads the rules with enabled: true, and evaluates each one. There are two condition types:
count_threshold: a_ts >= now - windowcondition is added to the rule'squeryfilter and acountis run. The result is compared withthresholdusingoperator(gt,gte,lt,lte,eq,ne; defaultgte).aggregation_threshold: a{"$match": {"_ts": {"$gte": ...}}}stage is prepended to the rule'spipeline, the aggregation runs, and theresult_field(defaultcount) of the first result document is compared with the threshold.
window is written like "30s", "5m", "1h" and defaults to 5 minutes. When the condition holds, the actions run: webhook (an HTTP POST with a JSON body, fire-and-forget on its own thread so the evaluator is not blocked), stderr (an [ALERT] line in the server log) and log. Whatever actions are configured, a record is written to _alert_history, and the rule's last_fired, last_fired_epoch and fire_count fields are updated.
The cooldown relies on those fields: if now < last_fired_epoch + cooldown_seconds, the rule is not evaluated at all. The default is 300 seconds.
A real run: a local webhook receiver
I ran a tiny Python HTTP server on 127.0.0.1:15906 that prints every POST with a timestamp:
import http.server, datetime
class H(http.server.BaseHTTPRequestHandler):
    def do_POST(self):
        n = int(self.headers.get("Content-Length", 0)); body = self.rfile.read(n)
        t = datetime.datetime.now().strftime("%H:%M:%S")
        print(f"[{t}] POST {self.path}  {body.decode()}", flush=True)
        self.send_response(204); self.end_headers()
    def log_message(self, *a): pass
http.server.ThreadingHTTPServer(("127.0.0.1", 15906), H).serve_forever()
Then I defined two rules, one count threshold and one aggregation threshold:
{"cmd": "create_alert", "name": "error-burst", "collection": "_gelf_logs",
 "condition": {"type": "count_threshold", "query": {"level": {"$lte": 3}}, "window": "1m", "threshold": 5, "operator": "gte"},
 "actions": [{"type": "webhook", "url": "http://127.0.0.1:15906/alerts"}, {"type": "stderr"}],
 "cooldown_seconds": 20}
{"ok": true, "data": "alert created: error-burst"}{"cmd": "create_alert", "name": "slow-requests", "collection": "_gelf_logs",
"condition": {"type": "aggregation_threshold", "window": "1m",
"pipeline": [{"$match": {"latency_ms": {"$gte": 500}}}, {"$group": {"_id": null, "n": {"$sum": 1}}}],
"result_field": "n", "threshold": 3, "operator": "gte"},
"actions": [{"type": "webhook", "url": "http://127.0.0.1:15906/alerts/slow"}],
"cooldown_seconds": 60}{"ok": true, "data": "alert created: slow-requests"}test_alert evaluates a rule immediately, without running actions and ignoring the cooldown:
{"cmd": "test_alert", "name": "error-burst"}{
"ok": true,
"data": {
"alert": "error-burst",
"type": "count_threshold",
"current_value": 0,
"threshold": 5,
"operator": "gte",
"would_fire": false
}
}It does not support aggregation rules yet, though:
{"cmd": "test_alert", "name": "slow-requests"}{"ok": true, "data": {"alert": "slow-requests", "error": "unsupported condition type: aggregation_threshold"}}Then I played a traffic scenario over GELF (local time):
[00:33:40] send 6 errors + 4 slow requests (latency >= 500 ms)
[00:33:46] send 3 more errors (still inside the 20 s cooldown)
[00:34:10] cooldown over; window still holds >= 5 errors
[00:34:20] done
What the webhook receiver saw:
[00:33:41] POST /alerts  {"alert_name":"error-burst","collection":"_gelf_logs","fired_at":"2026-10-11T21:33:41Z","fired_at_epoch":1791754421,"condition_result":6,"threshold":5,"operator":"gte"}
[00:33:41] POST /alerts/slow  {"alert_name":"slow-requests","collection":"_gelf_logs","fired_at":"2026-10-11T21:33:41Z","fired_at_epoch":1791754421,"condition_result":4,"threshold":3,"operator":"gte"}
[00:34:01] POST /alerts  {"alert_name":"error-burst","collection":"_gelf_logs","fired_at":"2026-10-11T21:34:01Z","fired_at_epoch":1791754441,"condition_result":9,"threshold":5,"operator":"gte"}
[00:34:21] POST /alerts  {"alert_name":"error-burst","collection":"_gelf_logs","fired_at":"2026-10-11T21:34:21Z","fired_at_epoch":1791754461,"condition_result":9,"threshold":5,"operator":"gte"}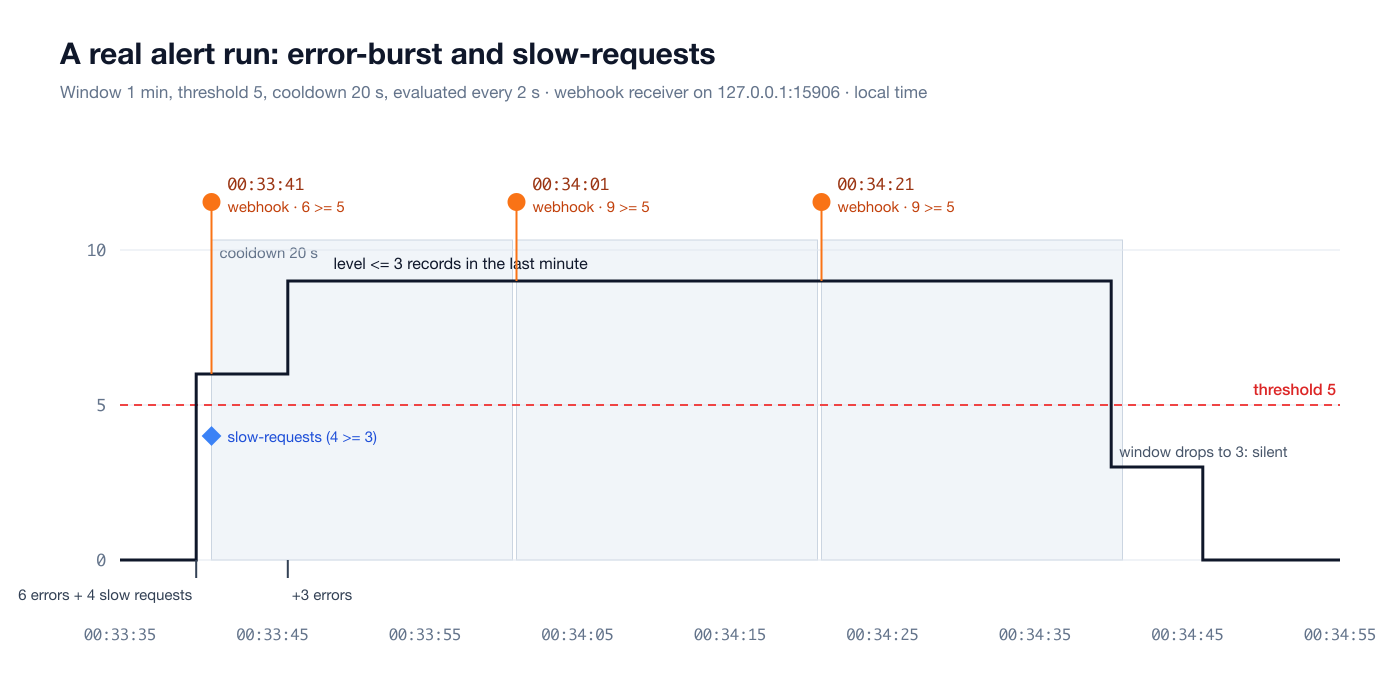
A few things are visible here:
- The first firing arrived one second after the packets, a result of the 2-second evaluation interval.
- The three extra errors at 00:33:46 did not produce a new notification, because the rule was in its cooldown.
- As long as the condition stays true, the rule fires again at the end of every cooldown: 00:34:01 and 00:34:21. So this is not an edge-triggered alert; it keeps reminding you while the condition lasts. When the errors left the 1-minute window at 00:34:40, the count dropped to 3 and the rule went quiet. There is no "resolved" notification.
- Every firing also put an
[ALERT] error-burst: _gelf_logs ...line on the server's stderr.
The history is a queryable collection:
{"cmd": "list_alert_history"}{
"ok": true,
"data": [
{
"alert_name": "error-burst",
"collection": "_gelf_logs",
"fired_at": "2026-10-11T21:33:41Z",
"fired_at_epoch": 1791754421,
"condition_result": 6,
"threshold": 5,
"operator": "gte",
"actions_executed": ["webhook", "stderr"],
"_ts": "2026-10-11T21:33:41Z",
"_id": 1,
"_version": 1
},
{
"alert_name": "slow-requests",
"collection": "_gelf_logs",
"fired_at": "2026-10-11T21:33:41Z",
"fired_at_epoch": 1791754421,
"condition_result": 4,
"threshold": 3,
"operator": "gte",
"actions_executed": ["webhook"],
"_ts": "2026-10-11T21:33:41Z",
"_id": 2,
"_version": 1
}
]
}(The first two of four records; the other two are the 00:34:01 and 00:34:21 firings.) The rule's own state was updated as well:
{'name': 'error-burst', 'enabled': True, 'cooldown_seconds': 20, 'fire_count': 3, 'last_fired': '2026-10-11T21:34:21Z', 'last_fired_epoch': 1791754461}Since _alert_history and _alerts are ordinary collections, you can put set_retention on them and even alert on them. There is no dedicated command to enable or disable a rule; I flipped enabled with a plain update on the _alerts collection:
{"cmd": "update", "collection": "_alerts", "query": {"name": {"$in": ["error-burst", "slow-requests"]}}, "update": {"$set": {"enabled": false}}}{"ok": true, "data": {"modified": 2}}Limits on the alerting side
I saw these in real tests too:
- Host names do not work in webhook URLs. The URL parser accepts
http://localhost:15906/..., but the connection is made by parsing thehost:porttext as a socket address, which does no DNS resolution. When a rule with alocalhostURL fired, nothing reached the receiver, yet the_alert_historyrecord said"actions_executed": ["webhook"]. Webhook failures are silent; use an IP address in the URL for now. http://only. No TLS. Sending a webhook to an external service needs a local relay in between.- The response is not read and there are no retries. The request is written and the connection closed; if the receiver is down at that moment, the notification is lost (and the history still says "webhook").
- Thresholds are integers. The aggregation result is read with
as_i64. With an average latency of 300.5 ms, anavg > 100rule never fired (fire_count: 0), while results that come out as integers from$sumworked fine. For fractional results you currently need to round in the pipeline. - The window is based on
_ts. The alert window compares_tswith an ISO string bound. GELF and raw UDP records carry a date string in_ts, so they are fine, but MessagePack records with a numeric_tsnever fall inside the window. I tested it: for a rule countingstatus: 503on_msgpack_logs,test_alertreturned"current_value": 0after a record with an epoch-ms_ts, and"current_value": 1once I sent the same record with an ISO string_ts.
All of these are fixable and on my list. But as it stands, the alert engine works well for "this many errors in the last N minutes" kinds of jobs.
oxidb-tail: live logs in the terminal
oxidb-tail is a terminal UI (ratatui + crossterm) that connects to OxiDB over the wire protocol. Its dependencies are light, so it builds quickly; a clean release build took 15.45 seconds on my machine:
cargo build --release -p oxidb-tail
./target/release/oxidb-tail --host 127.0.0.1 --port 15900
While it was running I sent a 60-message stream over GELF; this is the screen I captured inside tmux:
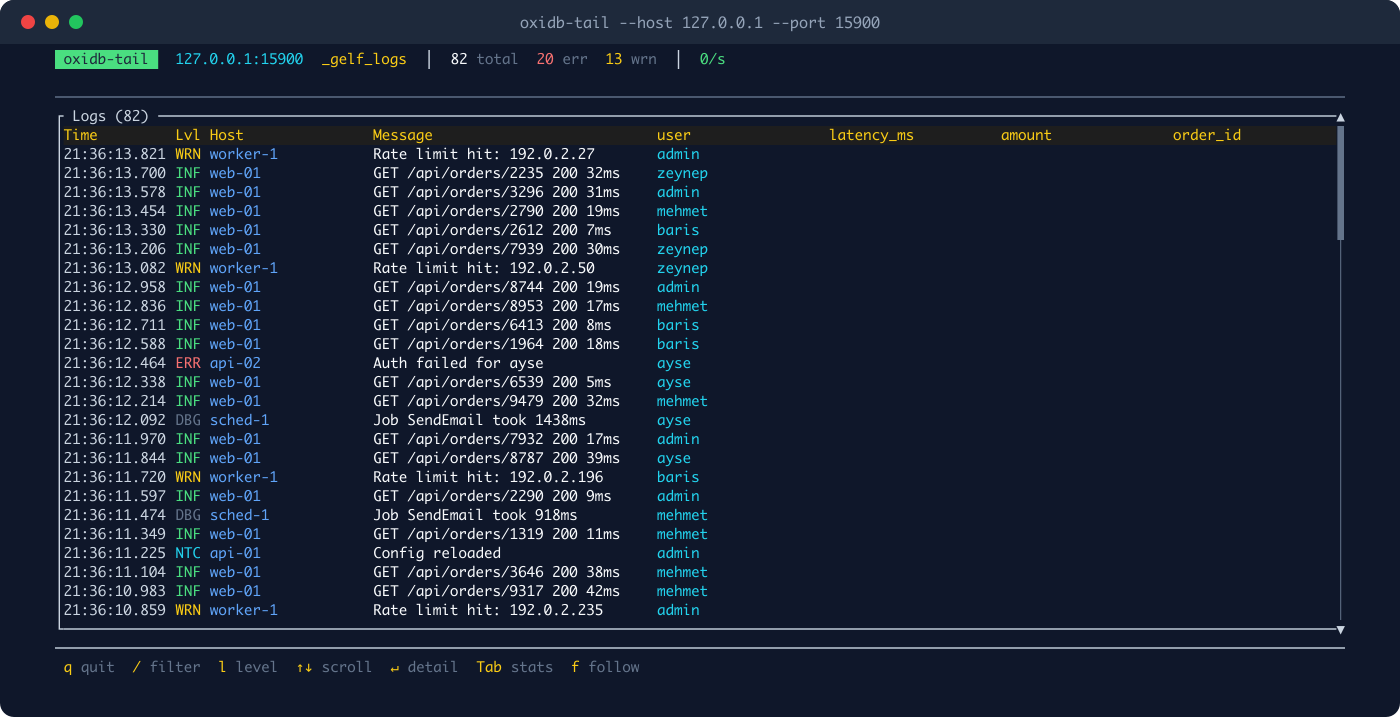
How it works is simple: every --interval milliseconds (500 by default) it sends {"_id": {"$gt": last_id}} to the collection and fetches up to 200 records sorted by _id. Levels are colored by syslog level: 0-3 red, 4 yellow, 5 cyan, 6 green, 7 gray. It picks the most common additional fields from the first batch as columns and locks them in. There is a text filter on /, a level filter on l, all fields of the selected record on Enter, and a side panel with the host distribution on Tab.
To be honest here too, there are two small quirks. Because the columns are locked from the first batch, the screen shows columns like latency_ms, amount and order_id that are empty for this stream, while client_ip does not appear. Second, the initial load takes the first 100 records in ascending _id order, so against a very large collection it starts from the oldest and takes a while to catch up. The time column is read from _ts, so on MessagePack collections with a numeric _ts it shows ??:??:??. As the name says, the tool was written for GELF collections.
The server writing its own logs into itself
There is a nice ending to the story: OxiDB does not only receive logs, it can also send its own logs somewhere as GELF or MessagePack. With OXIDB_GELF_ADDR set, wire connection events and server messages go there; with OXIDB_MSGPACK_ADDR set, the REST layer's request log does. The target can be the server itself. I restarted the server pointing at its own ports (before and after the restart _gelf_logs had 199,868 and _msgpack_logs 250,005 records; nothing lost):
OXIDB_GELF_ADDR=127.0.0.1:15908 OXIDB_MSGPACK_ADDR=127.0.0.1:15909 HOSTNAME=oxidb-demo ...After opening and closing one wire connection, _gelf_logs contained:
{
 "host": "oxidb-demo",
 "short_message": "client connected: 127.0.0.1:50139",
 "timestamp": 1791754653.456128,
 "level": 6,
 "peer": "127.0.0.1:50139",
 "_ts": "2026-10-11T21:37:33.462529+00:00",
 "_id": 199869,
 "_version": 1
}
With REST enabled as well (OXIDB_HTTP_PORT) and two curl requests, _msgpack_logs contained:
{
 "host": "oxidb-demo",
 "short_message": "GET /api/collections",
 "level": 6,
 "ts": 1791754676.108999,
 "_ts": 1791754676108,
 "app": "oxidb-server",
 "method": "GET",
 "path": "/api/collections",
 "status": "200",
 "ms": "0",
 "db": "",
 "user_agent": "curl/8.7.1",
 "_id": 250008,
 "_version": 1
}
The request that returned 404 was written with level: 4 (warning). The db field is the one that feeds the tenant routing described above. And as you can see, _ts is numeric here; this is exactly where the retention defect bites in practice.
How it fits with the rest of OxiDB
The log engine is not a separate storage engine. It is inputs placed in front of the document engine and two background threads behind it. As a result:
- All of the document engine's query and aggregation features work on logs. If you want text search over error messages, add a full-text index to the collection.
- Durability is the document engine's: WAL, CRC32, fsync. I saw no record loss across restarts. UDP itself, however, guarantees no delivery; a packet that never reaches the server, or is dropped because the channel is full, leaves no trace anywhere.
- For numeric, regularly spaced data like metrics, the time series engine is the better fit, with compression and block-based retention. The log engine is for irregular, structured, text-heavy records.
- The project's 1.0 stability ADR (ADR-0003) keeps the GELF input and TTL indexes in the group that "works and ships, but a 1.x minor can change a request/response shape". So this surface is not yet under a backward-compatibility promise, which gives me room to change behavior while fixing the defects above.
Summary and trying it out
The GELF input gives you "point the application at OxiDB instead of Graylog and get every field indexed"; the price is an index per field and possible packet loss when a new field first arrives. The MessagePack input deliberately does less: no indexes, smaller packets, more resilient to bursts. Retention is a thin wrapper around the document engine's TTL machinery, and alerts are documents in the _alerts collection evaluated in the background. All in one process, without setting up a separate service.
The defects I found while preparing this post (the TTL not following a retention change, numeric _ts records never expiring, localhost webhooks failing silently, fractional aggregation results never alerting, test_alert not supporting aggregation rules, GELF packet loss on new fields) are on the work list for the next releases.
If you want to try it, prebuilt binaries are on the GitHub releases page, and a Docker image can be built from the Dockerfile in the repository. The shortest path:
OXIDB_GELF_PORT=12201 OXIDB_MSGPACK_PORT=12202 ./oxidb-serverThen point your application's GELF logger at UDP 12201 (with compression off) and watch with oxidb-tail --host 127.0.0.1 --port 4444. In the next post of the series I cover the ledger engine.