The OxiDB document engine: schemaless collections, the planner and a three-phase commit
The document engine at the core of OxiDB: MongoDB-style queries and aggregation, indexes and the planner, disk-first storage, the WAL, OCC transactions and read snapshots, with every example run against a real server.
I started OxiDB as a document database. Today the same process also holds SQL tables, time series, a Redis-compatible key-value store, S3, MQTT and AMQP, but underneath all of it sits the part I wrote first: schemaless JSON collections, MongoDB-style queries and an aggregation pipeline. This post is about that core. How to turn it on, which queries and updates it understands, what is in the pipeline, how indexes and the planner make their decisions, and then the inside: how documents sit on disk, when the WAL is fsync'd, the exact moment a transaction counts as committed, and why read snapshots leave the write path untouched. Every output shown here I ran myself against a local OxiDB 0.44.2 server on an Apple M4 Mac. No invented numbers.
Each engine gets its own post in this series. Full-text and vector search and the geospatial and graph stages also run on top of the document engine, but they have posts of their own: full-text and vector search and geospatial and graph queries.
What the document engine is for
The document engine is for applications whose data changes shape over time. In a product catalog one item has a specs.switch field and another has a reviews array. An order document carries five fields today and seven in six months. In a relational table each of those is a migration. Here a collection is created on its first insert and every document carries its own fields.
The document engine is on by default in OxiDB. Start the server without enabling anything else and it is all you have. The SQL engine is a separate engine with its own files (the SQL engine post), so a collection name and a table name can never collide.
Running it
One binary, no configuration:
OXIDB_ADDR=127.0.0.1:15100 \
OXIDB_DATA=./data \
OXIDB_HTTP_PORT=15106 \
OXIDB_WS_PORT=15107 \
./oxidb-server --verbose
On startup the server says what it is doing:
[verbose] opening database at ./data/oxidb
[verbose] blob store opened
[verbose] FTS index loaded
TTL eviction: enabled (interval=1000ms)
oxidb-server listening on 127.0.0.1:15100 (pool_size=4, data_dir=./data, idle_timeout=0s)
REST HTTP API listening on 0.0.0.0:15106
WebSocket API listening on 0.0.0.0:15107
One line I left out of this excerpt: the server also announces that "lazy sync" is disabled, meaning every commit is fsync'd (strict mode).
The native wire protocol is simple: a 4-byte little-endian length, then a JSON object. Every request has a cmd field and every response is {"ok": true, "data": ...} or {"ok": false, "error": "..."}. I ran every example in this post through this tiny Python client, no library needed:
import socket, struct, json

class Ox:
    def __init__(self, port=15100):
        self.s = socket.create_connection(("127.0.0.1", port))

    def __call__(self, req):
        b = json.dumps(req).encode()
        self.s.sendall(struct.pack("<I", len(b)) + b)
        n = struct.unpack("<I", self._read(4))[0]
        return json.loads(self._read(n))

    def _read(self, n):
        d = b""
        while len(d) < n:
            d += self.s.recv(n - len(d))
        return d
There are ready clients for Python, Go, .NET, JS/TS, Java, Julia and Swift, plus OxiWire (a compact binary framing), REST and WebSocket. They all speak the same request shape.
Data model: schemaless collections
No need to create a collection before inserting into it:
> {"cmd": "insert", "collection": "products", "doc": {"sku": "KB-01", "name": "Mechanical keyboard", "price": 89, "tags": ["usb", "rgb"], "stock": {"ist": 12, "ank": 0}, "specs": {"switch": "brown", "layout": "TR-Q"}}}
< {"ok": true, "data": {"id": 1}}
> {"cmd": "insert_many", "collection": "products", "docs": [{"sku": "MS-02", ...}, {"sku": "MN-27", ...}, {"sku": "CB-10", ...}, {"sku": "HD-05", ...}]}
< {"ok": true, "data": [2, 3, 4, 5]}
(The ... in the second request is my abbreviation; the full documents show up in the query outputs below.)
Every document gets two system fields. _id is an increasing integer within the collection, and _version goes up by one on every write. _version is not just informational: the whole validation of optimistic transactions rests on it, which I will come back to. Nested fields are reached with dot notation (stock.ank, specs.switch) in queries and updates alike.
On disk documents are not stored as JSON text but in the binary JSONB format, which lets a single top-level field be read without decoding the whole document. The planner and the indexes lean on that.
Queries
The query language is deliberately close to MongoDB's: $eq $ne $gt $gte $lt $lte $in $nin $exists $regex $elemMatch $all $size $not $type $mod $and $or $nor $expr, and find also takes sort, skip and limit.
> {"cmd": "find", "collection": "products", "query": {"stock.ank": {"$gt": 0}, "discontinued": {"$exists": false}}, "sort": {"price": 1}, "limit": 2}
< {"ok": true, "data": [{"sku": "CB-10", "name": "USB-C cable", "price": 9, "tags": ["usb-c"], "stock": {"ist": 200, "ank": 120}, "_id": 4, "_version": 1}, {"sku": "MS-02", "name": "Wireless mouse", "price": 29, "tags": ["bluetooth"], "stock": {"ist": 40, "ank": 15}, "_id": 2, "_version": 1}]}
$elemMatch for objects inside arrays, $regex for patterns, $expr to compare two fields of the same document:
> {"cmd": "find", "collection": "products", "query": {"reviews": {"$elemMatch": {"stars": {"$gte": 5}}}}}
< {"ok": true, "data": [{"sku": "MN-27", "name": "27 inch monitor", "price": 249, "tags": ["usb-c", "hdr"], "stock": {"ist": 3, "ank": 7}, "reviews": [{"by": "ayse", "stars": 5}, {"by": "mert", "stars": 3}], "_id": 3, "_version": 1}]}
> {"cmd": "find", "collection": "products", "query": {"$or": [{"name": {"$regex": "^usb", "$options": "i"}}, {"tags": {"$all": ["usb", "bluetooth"]}}]}}
< {"ok": true, "data": [{"sku": "CB-10", ...}, {"sku": "HD-05", ...}]}
> {"cmd": "find", "collection": "products", "query": {"$expr": {"$gt": ["$stock.ank", "$stock.ist"]}}}
< {"ok": true, "data": [{"sku": "MN-27", "name": "27 inch monitor", ...}]}
While preparing these examples I ran into a difference that will surprise anyone coming from MongoDB, and I would rather say so. In MongoDB {"tags": "usb"} matches every document whose tags array contains "usb". In OxiDB 0.44.2 scalar equality compares against the whole field value and does not look inside an array:
> {"cmd": "count", "collection": "products", "query": {"tags": "usb"}}
< {"ok": true, "data": {"count": 0}}
> {"cmd": "count", "collection": "products", "query": {"tags": {"$all": ["usb"]}}}
< {"ok": true, "data": {"count": 2}}
To find an element in an array, use $all or $elemMatch. In the code (src/query.rs, eval_field_op) this is not a deliberate branch, just array semantics that have not reached equality yet. It is on my list.
Updates
Update operators: $set $unset $inc $mul $min $max $rename $currentDate, and for arrays $push (with $each and $slice) $pull $addToSet $pop. Several operators can go into one request, and an update to one document is atomic:
> {"cmd": "update_one", "collection": "products", "query": {"sku": "KB-01"}, "update": {"$inc": {"stock.ank": 5}, "$push": {"tags": "hot-swap"}, "$set": {"specs.switch": "red"}, "$currentDate": {"updated_at": true}}}
< {"ok": true, "data": {"modified": 1}}
> {"cmd": "update", "collection": "products", "query": {"tags": {"$all": ["usb-c"]}}, "update": {"$mul": {"price": 0.9}, "$addToSet": {"tags": "sale"}}}
< {"ok": true, "data": {"modified": 2}}
> {"cmd": "update_one", "collection": "products", "query": {"sku": "HD-05"}, "update": {"$rename": {"discontinued": "archived"}, "$pull": {"tags": "usb"}}}
< {"ok": true, "data": {"modified": 1}}
> {"cmd": "find", "collection": "products", "query": {"sku": {"$in": ["KB-01", "MN-27", "HD-05"]}}, "sort": {"sku": 1}}
< {"ok": true, "data": [
    {"sku": "HD-05", "name": "Headset", "price": 59, "tags": ["bluetooth"], "_version": 2, "_id": 5, "archived": true},
    {"sku": "KB-01", "name": "Mechanical keyboard", "price": 89, "tags": ["usb", "rgb", "hot-swap"], "stock": {"ist": 12, "ank": 5}, "specs": {"switch": "red", "layout": "TR-Q"}, "_id": 1, "_version": 2, "updated_at": "2026-10-11T21:34:50.373050+00:00"},
    {"sku": "MN-27", "name": "27 inch monitor", "price": 224.1, "tags": ["usb-c", "hdr", "sale"], ..., "_id": 3, "_version": 2}]}
For single hot documents such as counters there is find_and_modify. It updates atomically outside any transaction and returns the new document:
> {"cmd": "find_and_modify", "collection": "counters", "query": {"_name": "invoice"}, "update": {"$inc": {"seq": 1}}}
< {"ok": true, "data": {"_name": "invoice", "seq": 1001, "_id": 1, "_version": 2}}
The aggregation pipeline
To show the pipeline on something bigger I loaded 500 customers and 20,000 orders. Orders have order_no, customer ("c1" to "c500"), status (paid, shipped, cancelled), amount, items and created (ISO dates from the first half of 2026). One insert_many call carries 5,000 documents, and loading all 20,000 took 0.17 seconds.
Supported stages: $match $group $sort $skip $limit $project $count $unwind $addFields $lookup $facet $replaceRoot $out $setWindowFields $dateHistogram $ohlcv $densify $fill, plus $geoNear, $graphLookup and $shortestPath, which I cover in the geospatial and graph post. $group accumulators: $sum $avg $min $max $count $first $last $push $addToSet $percentile.
$group and $lookup
The three biggest spenders, joined with the customers collection:
> {"cmd": "aggregate", "collection": "orders", "pipeline": [
    {"$match": {"status": "paid"}},
    {"$group": {"_id": "$customer", "spent": {"$sum": "$amount"}, "orders": {"$sum": 1}}},
    {"$sort": {"spent": -1}}, {"$limit": 3},
    {"$lookup": {"from": "customers", "localField": "_id", "foreignField": "code", "as": "c"}},
    {"$unwind": "$c"},
    {"$project": {"_id": 0, "customer": "$_id", "name": "$c.name", "region": "$c.region", "spent": 1, "orders": 1}}]}
< {"ok": true, "data": [{"customer": "c77", "name": "Customer 77", "region": "Izmir", "spent": 10331, "orders": 39}, {"customer": "c57", "name": "Customer 57", "region": "Antalya", "spent": 10303, "orders": 35}, {"customer": "c497", "name": "Customer 497", "region": "Istanbul", "spent": 10279, "orders": 34}]}
$lookup runs an ordinary find against the foreign collection, so with an index on foreignField (here a unique index on customers.code) each join is an index lookup. Joins on several fields work through localFields and foreignFields arrays.
$facet
$facet runs several independent sub-pipelines over the same input in one pass, so three dashboard tiles come from one query instead of three scans:
> {"cmd": "aggregate", "collection": "orders", "pipeline": [
    {"$match": {"created": {"$gte": "2026-06-01", "$lt": "2026-07-01"}}},
    {"$facet": {
      "byStatus": [{"$group": {"_id": "$status", "n": {"$sum": 1}}}, {"$sort": {"n": -1}}],
      "bigTicket": [{"$match": {"amount": {"$gte": 495}}}, {"$count": "n"}],
      "avgBasket": [{"$group": {"_id": null, "avgItems": {"$avg": "$items"}, "maxAmount": {"$max": "$amount"}}}]}}]}
< {"ok": true, "data": [{"byStatus": [{"_id": "paid", "n": 1935}, {"_id": "shipped", "n": 945}, {"_id": "cancelled", "n": 345}], "bigTicket": [{"n": 40}], "avgBasket": [{"_id": null, "avgItems": 3.494263565891473, "maxAmount": 500}]}]}
Sub-pipelines work over a shared in-memory set, so $facet and $out are not allowed inside them (MongoDB has the same rule). Also note that the date comparison here is not a plain string comparison: indexes store ISO 8601-looking strings as epoch milliseconds, so range queries run in chronological order.
$setWindowFields
Window functions compute values from neighboring documents without collapsing rows the way $group does. A running total, the average of the last three orders and the previous amount, over one customer's first five orders:
> {"cmd": "aggregate", "collection": "orders", "pipeline": [
    {"$match": {"customer": "c42"}}, {"$sort": {"created": 1}}, {"$limit": 5},
    {"$setWindowFields": {"partitionBy": "$customer", "sortBy": {"created": 1}, "output": {
       "running": {"$sum": "$amount", "window": {"documents": ["unbounded", "current"]}},
       "avg3": {"$avg": "$amount", "window": {"documents": [-2, 0]}},
       "prev": {"$shift": {"output": "$amount", "by": -1, "default": 0}}}}},
    {"$project": {"_id": 0, "created": 1, "amount": 1, "running": 1, "avg3": 1, "prev": 1}}]}
< {"ok": true, "data": [
    {"created": "2026-01-10T02:27:44Z", "amount": 443, "running": 443, "avg3": 443, "prev": 0},
    {"created": "2026-01-15T13:47:23Z", "amount": 421, "running": 864, "avg3": 432, "prev": 443},
    {"created": "2026-01-17T22:53:17Z", "amount": 464, "running": 1328, "avg3": 442.6666666666667, "prev": 421},
    {"created": "2026-02-06T17:02:43Z", "amount": 217, "running": 1545, "avg3": 367.3333333333333, "prev": 464},
    {"created": "2026-02-06T20:34:44Z", "amount": 313, "running": 1858, "avg3": 331.3333333333333, "prev": 217}]}
Besides document windows there are range windows: window: {"range": [-5, 0], "unit": "minute"} means the last five minutes, not the last five documents. $rank, $denseRank and $documentNumber are supported too.
Time-shaped data: $dateHistogram, $ohlcv, $densify, $fill
I added these four stages so documents can be analyzed over time without a separate time series engine. (For serious compressed series with retention there is the time series engine.)
$dateHistogram buckets documents by calendar interval, and with min_doc_count: 0 it fills empty buckets with zero so a chart has no missing days:
> {"cmd": "aggregate", "collection": "logins", "pipeline": [{"$dateHistogram": {"field": "at", "interval": "1d", "min_doc_count": 0}}, {"$sort": {"_id": 1}}]}
< {"ok": true, "data": [{"_id": "2026-10-01T00:00:00Z", "count": 2}, {"_id": "2026-10-02T00:00:00Z", "count": 1}, {"_id": "2026-10-03T00:00:00Z", "count": 0}, {"_id": "2026-10-04T00:00:00Z", "count": 0}, {"_id": "2026-10-05T00:00:00Z", "count": 3}]}
$ohlcv turns trade ticks into candles. It sorts its input by time itself, partitions by instrument with symbol, and with fill: "previous" puts a flat candle carrying the previous close into a minute without trades:
> {"cmd": "aggregate", "collection": "ticks", "pipeline": [
    {"$ohlcv": {"time": "ts", "interval": "1m", "price": "price", "volume": "qty", "symbol": "sym", "fill": "previous"}},
    {"$project": {"_id": 0, "time": 1, "open": 1, "high": 1, "low": 1, "close": 1, "volume": 1, "count": 1}}]}
< {"ok": true, "data": [
    {"time": "2026-10-12T09:00:00Z", "open": 10.0, "high": 10.4, "low": 10.0, "close": 10.4, "volume": 150.0, "count": 2},
    {"time": "2026-10-12T09:01:00Z", "open": 10.2, "high": 10.9, "low": 10.2, "close": 10.9, "volume": 90.0, "count": 2},
    {"time": "2026-10-12T09:02:00Z", "open": 10.9, "high": 10.9, "low": 10.9, "close": 10.9, "volume": 0.0, "count": 0},
    {"time": "2026-10-12T09:03:00Z", "open": 10.7, "high": 10.7, "low": 10.7, "close": 10.7, "volume": 40.0, "count": 1}]}
$densify generates synthetic documents for missing steps and $fill fills them: locf (carry the last value forward), linear (interpolate) or a constant. A sensor example with two rooms:
> {"cmd": "aggregate", "collection": "sensor", "pipeline": [
    {"$densify": {"field": "t", "partitionByFields": ["room"], "range": {"step": 1, "bounds": "partition"}}},
    {"$fill": {"sortBy": {"t": 1}, "partitionBy": "$room", "output": {"temp": {"method": "linear"}}}},
    {"$sort": {"room": 1, "t": 1}}, {"$project": {"_id": 0, "room": 1, "t": 1, "temp": 1}}]}
< {"ok": true, "data": [
    {"room": "depo", "t": 0, "temp": 12.0}, {"room": "depo", "t": 1, "temp": 12.333333333333334},
    {"room": "depo", "t": 2, "temp": 12.666666666666666}, {"room": "depo", "t": 3, "temp": 13.0},
    {"room": "lab", "t": 0, "temp": 20.0}, {"room": "lab", "t": 1, "temp": 21.0},
    {"room": "lab", "t": 2, "temp": 22.166666666666668}, {"room": "lab", "t": 3, "temp": 23.333333333333332},
    {"room": "lab", "t": 4, "temp": 24.5}]}
I tripped over my own design here, and it is worth writing down. On the first try I gave $fill the same "partitionByFields": ["room"] that $densify takes. $fill does not know that key, it expects "partitionBy": "$room", and it silently ignores keys it does not know. The result was the storage room's gap filled with the lab's temperatures (depo, t=1, temp=21.0). Two stages with different partition keys, and an unknown key that does not raise an error, is a rough edge that needs fixing.
These stages have a budget. If $densify or $ohlcv would generate more than a set number of documents, they fail with an error instead of quietly truncating the result. Those budgets arrived in a hardening pass in 0.44.2, together with a value budget for $setWindowFields.
Indexes and the planner
Index types
- Field index (
create_index): equality, ranges,$in, sorting and counting. - Unique index (
create_unique_index): rejects violations as an error. - Composite index (
create_composite_index): prefix scans and covered aggregation. - TTL index (
create_ttl_index): removes expired documents in the background. - Full-text and vector indexes: in their own post.
Indexes backfill over existing data as soon as they are created. Unique and TTL in action:
> {"cmd": "create_unique_index", "collection": "customers", "field": "code"}
< {"ok": true, "data": "unique index created"}
> {"cmd": "insert", "collection": "customers", "doc": {"code": "c42", "name": "Duplicate"}}
< {"ok": false, "error": "unique constraint violated: field 'code' value already exists"}

> {"cmd": "create_ttl_index", "collection": "sessions", "field": "created_at", "expireAfterSeconds": 2}
< {"ok": true, "data": "ttl index created"}
> {"cmd": "insert", "collection": "sessions", "doc": {"user": "ayse", "created_at": "2026-10-11T21:35:53Z"}}
< {"ok": true, "data": {"id": 1}}
> {"cmd": "count", "collection": "sessions"}
< {"ok": true, "data": {"count": 1}}
# 4.5 seconds later
> {"cmd": "count", "collection": "sessions"}
< {"ok": true, "data": {"count": 0}}
The TTL sweep runs once a second. Log retention uses the same machinery (the logs and alerting post).
explain
To see what the planner does there is explain. It wraps a find, count or aggregate, reports the plan, and actually runs the query to time it. The plan is computed by the same functions the real query path calls, so what explain says and what the engine does cannot drift apart. Without indexes:
> {"cmd": "explain", "inner": {"cmd": "find", "collection": "orders", "query": {"customer": "c42", "status": "paid"}}}
< {"ok": true, "data": {"strategy": "COLLSCAN", "index_used": null, "collection_docs": 20000, "candidates": null, "examined": 20000, "returned": 18, "post_filter": true, "post_filter_ops": [], "sort": "none", "duration_ms": 4.715}}
After creating field indexes on customer, status and created, and a composite index on [status, amount]:
> {"cmd": "explain", "inner": {"cmd": "find", "collection": "orders", "query": {"customer": "c42", "status": "paid"}}}
< {"ok": true, "data": {"strategy": "INDEX_SCAN", "index_used": ["customer", "status"], "collection_docs": 20000, "candidates": 18, "examined": 18, "returned": 18, "post_filter": false, "post_filter_ops": [], "sort": "none", "duration_ms": 0.544}}
> {"cmd": "explain", "inner": {"cmd": "find", "collection": "orders", "query": {"customer": "c42", "amount": {"$gt": 400}, "status": {"$ne": "cancelled"}}}}
< {"ok": true, "data": {"strategy": "INDEX_SCAN", "index_used": ["customer"], "collection_docs": 20000, "candidates": 34, "examined": 34, "returned": 11, "post_filter": true, "post_filter_ops": ["$ne"], "sort": "none", "duration_ms": 0.015}}
post_filter_ops lists the operators an index cannot serve. $ne has to include documents that lack the field, so it is not answered from the index. The planner narrows to 34 candidates through the customer index and evaluates $ne on those 34.
Selectivity and index intersection
The planner estimates cost from the indexes themselves: the key count for an equality, the count inside a range, the sum for $in. When an $and has several indexed conditions it picks the most selective one (the one returning the fewest documents) as the driver and walks it lazily, intersecting with the sets of the other indexed conditions.
Measuring this, I found something I did not expect. The intersection materializes the other conditions' sets first, and status = paid is about 12,000 documents, so the intersection is expensive:
{'customer': 'c42'}                       INDEX_SCAN ['customer']            0.007 ms
{'customer': 'c42', 'status': 'paid'}     INDEX_SCAN ['customer', 'status']  0.554 ms
{'customer': 'c42', 'items': {'$gte': 5}} INDEX_SCAN ['customer']            0.005 ms
(Median of 15 runs.) An index on an unselective field makes this query slower: filtering 34 candidates one by one is far cheaper than building a set of 12,000 ids. The third query, whose items condition has no index and falls to a post-filter, is the fastest. A better rule would skip the intersection when the driver's candidate count is small; that is on my list. Until then, the practical advice is to prefer a composite index over a standalone index on low-cardinality fields (status, flags).
Sorting off the B-tree, index-only count, covered $group
The planner has three shortcuts:
- Sorting from the index. If the sort field has an index, the engine walks the B-tree in order instead of sorting the result, and stops when
limitis filled. If the filter's own index would be cheaper than the walk, the planner steps the walk down; explain asks the same question through the same function. - Index-only count. For an indexed equality,
countreads the number from the index without touching a document. - Covered
$group. In a[$match?] → $grouppipeline where the group key and every$sum/$avg/$min/$maxfield live in one composite index, the answer comes from walking that B-tree. Each entry already has the value tuple and its document count, sosum += value × count. No document is read or decoded.
> {"cmd": "explain", "inner": {"cmd": "find", "collection": "orders", "query": {"status": "paid"}, "sort": {"created": -1}, "limit": 10}}
< {"ok": true, "data": {"strategy": "INDEX_SORT", "index_used": "created", "collection_docs": 20000, "candidates": 11949, "examined": 20000, "returned": 10, "post_filter": false, "post_filter_ops": [], "sort": "index-backed", "duration_ms": 0.015}}
> {"cmd": "explain", "inner": {"cmd": "count", "collection": "orders", "query": {"status": "cancelled"}}}
< {"ok": true, "data": {"strategy": "INDEX_ONLY_COUNT", "index_only": true, "post_filter_ops": [], "count": 2037, "duration_ms": 0.0}}
(For INDEX_SORT the examined field reports the worst case; the walk stops early once limit is filled.)
The same four queries without and with indexes:
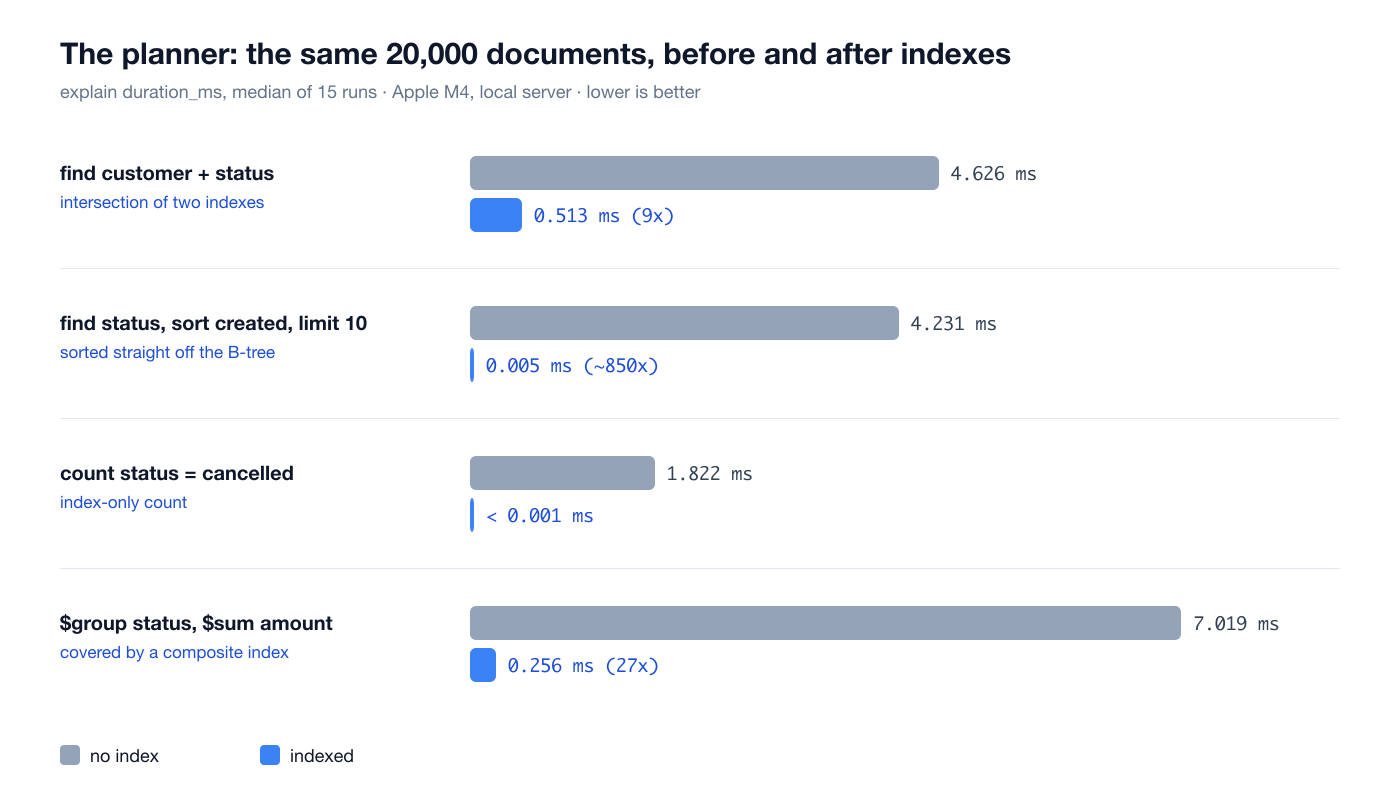
One caveat for the covered $group: if the indexed value is a string that was turned into a date, or the serialization of an array or object, the engine cannot reproduce the original value and falls back to the normal path. It is a shortcut and never changes the answer.
Storage format
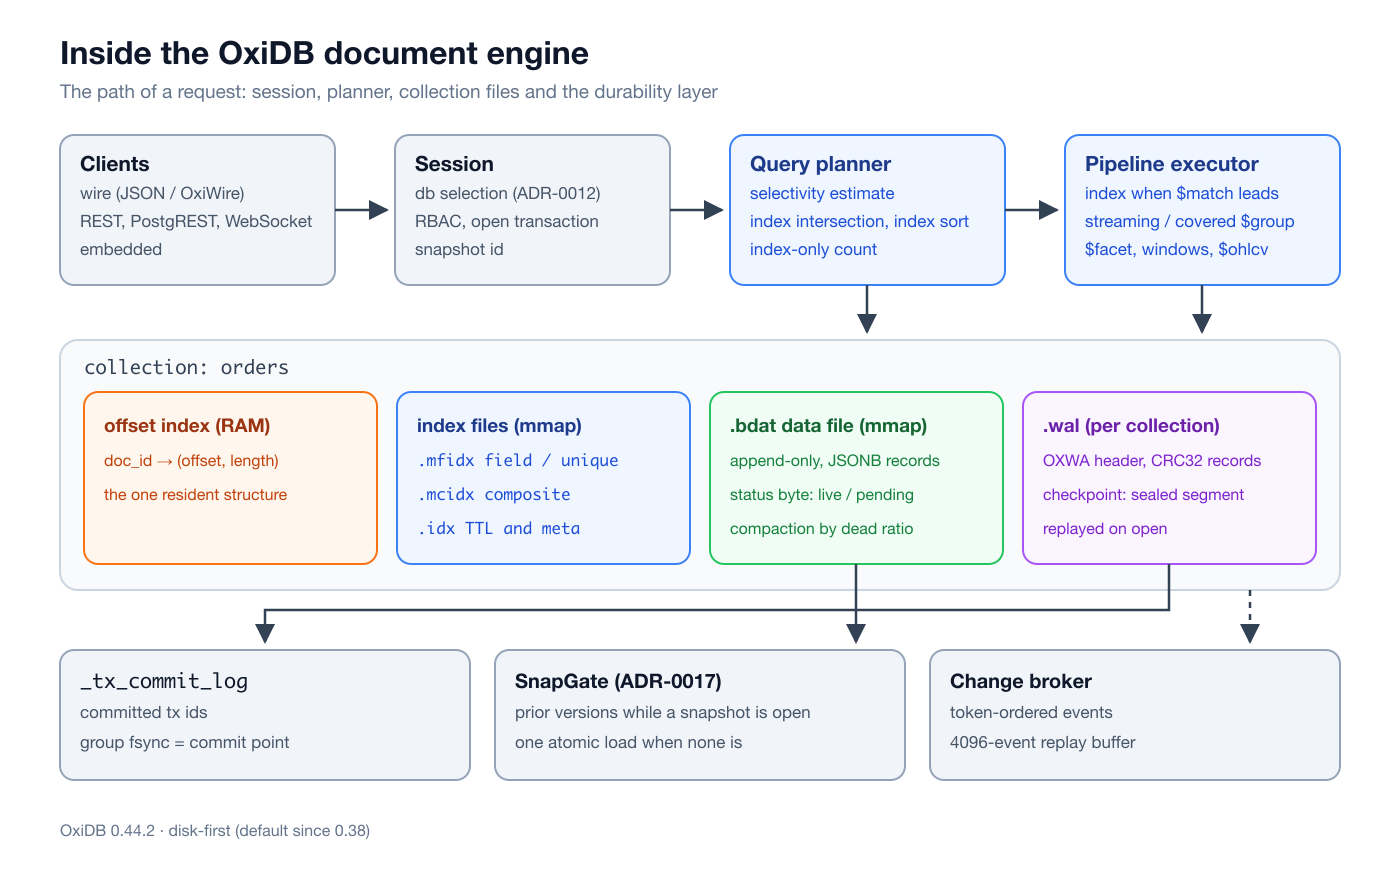
Until a few months ago OxiDB was really an in-memory database with disk persistence: every document's bytes lived in RAM and the .btree file was a periodic snapshot. In a one-million-document comparison memory grew in step with the data. I changed that with "disk-first" mode in ADR-0009, and it has been the default since 0.38:
- The
.bdatdata file. Append-only, read through mmap. Every record starts with a status byte and a length. An update appends the new record and marks the old one dead. - The offset index. The only structure that stays in RAM:
doc_id → (offset, length), a few tens of bytes per document. ADR-0018 discusses ways to shrink it further, and is upfront that at 100 million documents it is a floor of several GB. - Index files. Field indexes as
.mfidxand composite indexes as.mcidx, opened through mmap behind a small in-memory write overlay. On startup they are mapped, not rebuilt. - Compaction. When dead space is at least half the file and the file is at least 4 MiB, the maintenance thread writes the live records into a new file and swaps it in atomically. Indexes are keyed by
doc_id, so nothing has to be re-indexed. - Compression is opt-in. Per-record zstd made aggregations and index builds about four times slower in the project's own one-million-document measurements, for a small disk saving, so since 0.38.9 the default is uncompressed.
OXIDB_DISK_COMPRESSEDturns it on.
Per-collection options are written to <name>.bopts, which makes a collection's disk format persistent and independent of environment variables. My test database's directory looked like this:
$ ls -la data/oxidb | awk '{print $5, $9}'
3313100  orders.bdat
130      orders.bopts
659712   orders.created.mfidx
174430   orders.customer.mfidx
160131   orders.status.mfidx
226177   orders.status_amount.mcidx
347      orders.idx
3713108  orders.wal
0        orders.worm
8        _tx_commit_log
...
$ cat data/oxidb/accounts.bopts
{
  "disk_first": true,
  "compress": false,
  "auto_compact": true,
  "compact_min_bytes": 4194304,
  "compact_dead_ratio": 0.5
}
(The .worm files hold document-level immutability locks, which are outside the scope of this post.)
WAL and durability
Every collection has its own .wal file. It starts with the OXWA magic bytes and a version, followed by records of the form [crc32][length][payload]. The payload's first byte is the operation (insert, update, delete), then tx_id, doc_id and the document's JSONB bytes. With point-in-time recovery enabled, records also carry a global sequence number (GSN) and a wall clock. During recovery a record whose CRC does not match, or a half-written last record, is treated as a torn tail and reading stops there. With xxd:
$ xxd data/oxidb/accounts.wal | head -3
00000000: 4f58 5741 0100 0000 c0e1 8f1e 5600 0000  OXWA........V...
00000010: 0100 0000 0000 0000 0001 0000 0000 0000  ................
00000020: 0040 0000 0410 0000 0310 0000 0810 0000  .@..............
The default mode is strict: every commit is fsync'd before the client is told it succeeded. Checkpoints run online and seal the WAL instead of truncating it: the live file is renamed into a segment and a fresh WAL starts, so a checkpoint never races a writer.
I tried it myself. A transaction wrote to two collections, then one auto-commit write followed, and then I killed the server with kill -9, giving it no chance to shut down, and started it again:
$ python3 crash.py write
> {"cmd": "begin_tx"}
< {"ok": true, "data": {"tx_id": 7}}
> {"cmd": "insert", "collection": "ledger", "doc": {"entry": "debit", "account": "alice", "amount": 250}}
< {"ok": true, "data": {"id": 1}}
> {"cmd": "insert", "collection": "ledger_audit", "doc": {"entry": "credit", "account": "bob", "amount": 250}}
< {"ok": true, "data": {"id": 1}}
> {"cmd": "commit_tx"}
< {"ok": true, "data": "committed"}
> {"cmd": "insert", "collection": "ledger", "doc": {"entry": "note", "text": "auto-commit write"}}
< {"ok": true, "data": {"id": 2}}
$ kill -9 $(cat server.pid)   # immediately, no shutdown
$ ./start.sh
$ python3 crash.py read
> {"cmd": "find", "collection": "ledger", "query": {}}
< {"ok": true, "data": [{"_id": 1, "_version": 1, "account": "alice", "amount": 250, "entry": "debit"}, {"_id": 2, "_version": 1, "entry": "note", "text": "auto-commit write"}]}
> {"cmd": "find", "collection": "ledger_audit", "query": {}}
< {"ok": true, "data": [{"_id": 1, "_version": 1, "account": "bob", "amount": 250, "entry": "credit"}]}
One kill proves nothing, I know. The real assurance is in the repository's crash tests: kill matrices at specific byte offsets, a Jepsen-style bank that kills the process mid-commit and checks that money is conserved, and fsync fault injection, all run with cargo test -- --ignored. To be honest, those tests have proven me wrong more than once. In 0.40 they found a bug where a transaction spanning two collections could come back half-applied after a crash: in disk-first mode a record reached the data file before its commit mark was durable, and the rebuild on open took it for live. In 0.44.2 a storage audit found and closed five more recovery paths through which an acknowledged write could be lost. That history is why the "pending record" mechanism below exists.
Transactions: OCC and the three-phase commit
Transactions can span several documents and several collections. The model is optimistic concurrency control (OCC). After begin_tx, writes on the connection are buffered on the server ("buffered"), and every document read is recorded in a read set with the _version it had at the time. At commit the read set is validated:
> {"cmd": "begin_tx"}
< {"ok": true, "data": {"tx_id": 1}}
> {"cmd": "update", "collection": "accounts", "query": {"name": "alice"}, "update": {"$inc": {"balance": -30}}}
< {"ok": true, "data": "buffered"}
> {"cmd": "update", "collection": "accounts", "query": {"name": "bob"}, "update": {"$inc": {"balance": 30}}}
< {"ok": true, "data": "buffered"}
# from another connection, before the commit:
> {"cmd": "find", "collection": "accounts", "query": {}}
< {"ok": true, "data": [{"name": "alice", "balance": 100, "_id": 1, "_version": 1}, {"name": "bob", "balance": 50, "_id": 2, "_version": 1}]}
> {"cmd": "commit_tx"}
< {"ok": true, "data": "committed"}
# after the commit:
< {"ok": true, "data": [{"name": "alice", "balance": 70, "_id": 1, "_version": 2}, {"name": "bob", "balance": 80, "_id": 2, "_version": 2}]}
If two transactions read and write the same document, the second to commit learns about the conflict:
A> {"cmd": "begin_tx"}                     B> {"cmd": "begin_tx"}
A> find alice  → balance 70, _version 2    B> find alice → balance 70, _version 2
A> update alice $inc -50  → "buffered"     B> update alice $inc -60 → "buffered"
A> {"cmd": "commit_tx"}
< {"ok": true, "data": "committed"}
B> {"cmd": "commit_tx"}
< {"ok": false, "error": "transaction conflict on 'accounts' doc 1: expected version 2, found 3"}
(This block is condensed from the real output to show the order across two connections; the error message is the server's, verbatim.)
Inside the commit:
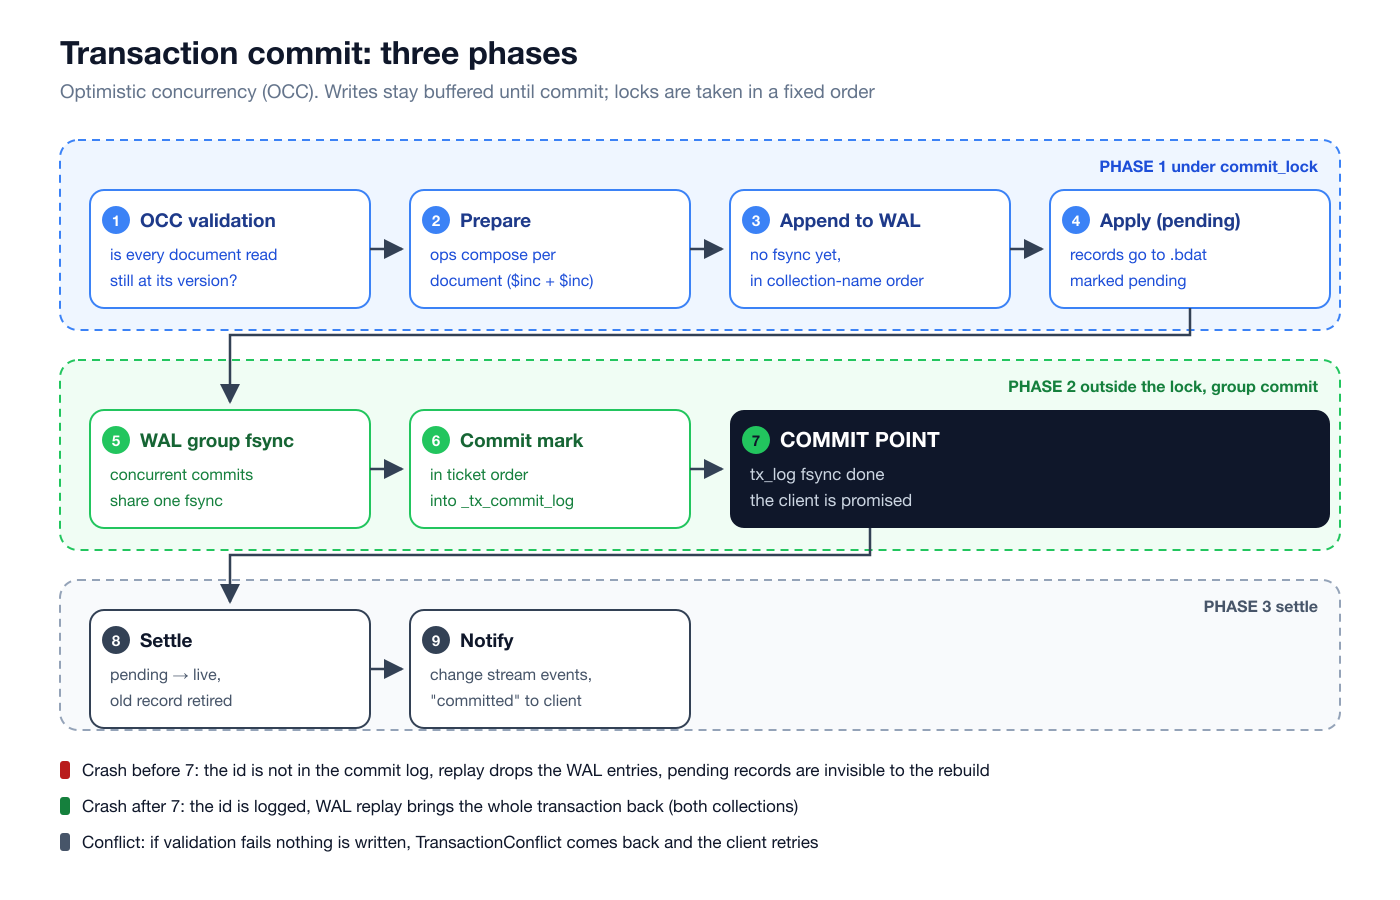
Phase 1 runs under the engine's commit_lock. The read set is validated. The writes are prepared, with successive operations on one document ($inc -2 then $inc +1) composed. The records are appended to each collection's WAL without fsync, then applied to the data file as "pending". Everything in this phase is memory and buffered file appends.
Phase 2 runs outside the lock. The WALs are fsync'd, but through sync_shared, so transactions committing at the same time share one physical fsync (group commit). Then the transaction id is written to _tx_commit_log in ticket order, and that file's fsync completes. That is exactly the commit point. Ticket order guarantees that a commit cannot become durable before another commit whose writes it may have read.
In Phase 3 the pending records are flipped to live and the records they displaced are marked dead. Then change events are published and the client gets "committed".
Recovery relies on this order in reverse. WAL entries of a tx_id that is not in the commit log are dropped on replay, and pending records are invisible to the rebuild. Entries of an id that is in the log are brought back in full. A transaction spanning two collections is either in both or in neither.
Why deadlock cannot happen. A transaction's collections are kept in a BTreeSet, and locks are always taken in the same order: first commit_lock, then the collection barriers by name. Direct (non-transactional) writes use the same order. A cycle of waits cannot form, so deadlock is structurally impossible.
find_for_update for hot documents. On a heavily contended document (a shared fee account, say) OCC can turn into a retry storm. find_for_update pessimistically locks the matched documents until commit or rollback, and others queue:
A> {"cmd": "find_for_update", "collection": "accounts", "query": {"name": "bob"}}
< {"ok": true, "data": [{"name": "bob", "balance": 80, "_id": 2, "_version": 2}]}
B> {"cmd": "find_for_update", "collection": "accounts", "query": {"name": "bob"}, "lock_timeout_ms": 300}
< {"ok": false, "error": "lock timeout on 'accounts' doc 2: held by another transaction"}
# waited 305 ms
These locks only exclude other for_update callers; OCC validation is still the correctness backstop. Abandoned transactions roll back after OXIDB_TX_MAX_IDLE_SECS (default 300 s), so a client that disappears cannot leave locks on the server, and a late request is told TransactionExpired rather than "not found".
The guarantee itself. docs/isolation.md has an anomaly scorecard pinned by tests. In short: committed transactions are serializable with respect to the documents they read and wrote. Dirty reads, dirty writes, lost updates and write skew over item reads are prevented. Two gaps are left on purpose. The first is phantoms: the read set holds the returned documents, not the query's predicate. The second is that non-transactional readers can see a commit's apply window half done. Inside a transaction you cannot read your own buffered writes before commit; compute the value you wrote instead. For predicate constraints such as "at most N open orders", the recommended pattern is to move the constraint into a counter document that every writer reads and updates, so OCC serializes on it. The same file describes an exactly-once pattern built on a unique index over request_id: the receipt is written in the same transaction, and a retry hits the unique violation and becomes "already applied".
Write throughput
When every commit is fsync'd, throughput is really fsync throughput. On macOS, Rust's sync_data uses F_FULLFSYNC, which actually flushes the drive and takes milliseconds. I measured three write shapes at 1, 4 and 16 concurrent connections:
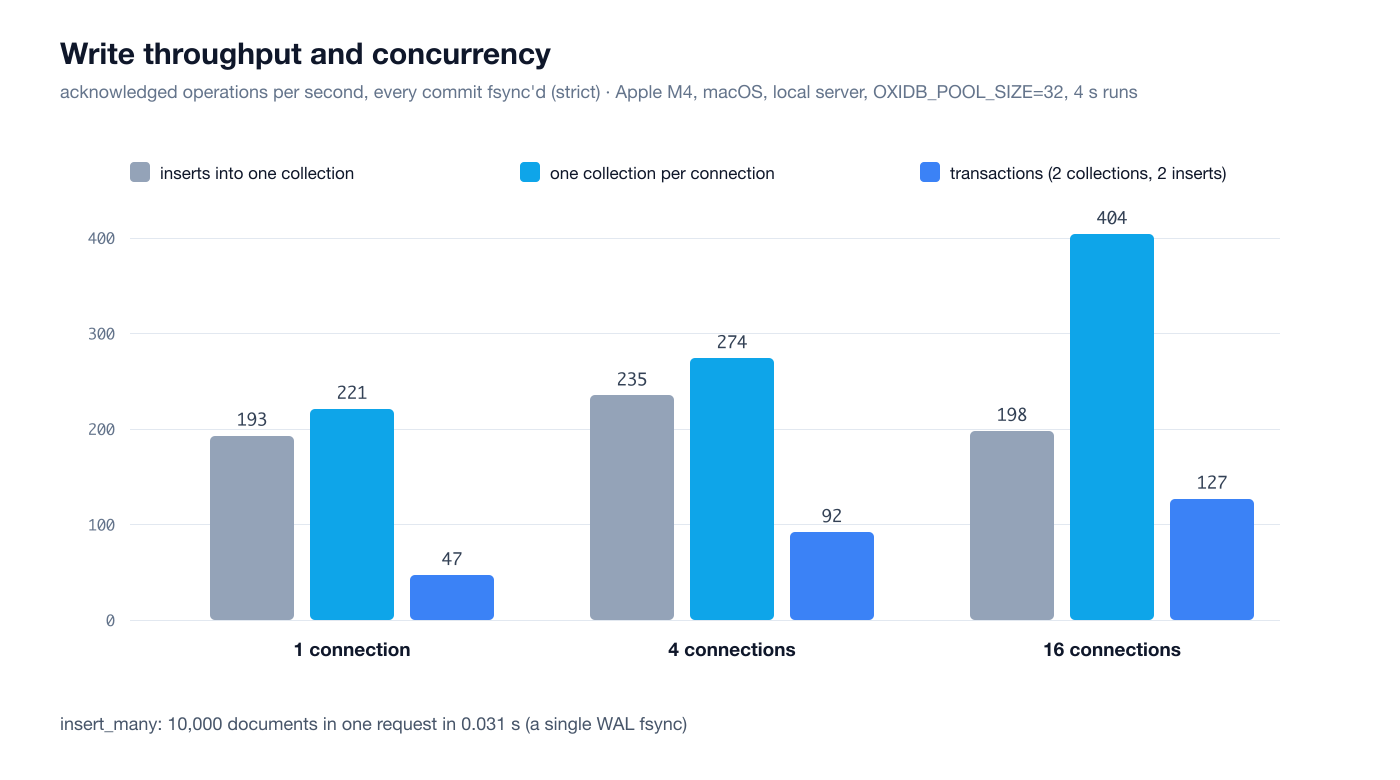
The result is instructive. Single auto-commit inserts into the same collection do not scale with connections (193, 235, 198 ops/s), because that path does its fsync serially per collection. When each connection writes to its own collection, it climbs to 404/s. Transactions go from 47 to 127 tx/s thanks to group commit, and each transaction is four round trips with one insert into each of two collections. Batch writes are in another class: a 10,000-document insert_many took 0.031 seconds because it shares a single WAL fsync. The practical lesson: batch heavy writes or group them in transactions. Single, concurrent, strictly durable writes into one collection are this engine's weakest spot.
MVCC-lite: read snapshots (ADR-0017)
OCC had a deliberate gap: a non-transactional reader could see document A after a commit and document B before it while that commit was being applied. A balance-sum report could produce a total that was never true at any moment. ADR-0017 fixes this on the read path only. The write path (OCC, find_for_update, group commit) is not touched.
The mechanism: while a snapshot is open, writers append the bytes they displace to an in-memory version map and move on. Writers never wait. With no snapshot open, which is the default, the cost is one atomic load per write. A snapshot begins under commit_lock.write() and every logical write records under commit_lock.read(), so "every change that became visible after the snapshot began" has a clean boundary. aggregate is snapshot-consistent by default, and the explicit snapshot API pins several queries to the same moment:
> {"cmd": "snapshot_begin"}
< {"ok": true, "data": {"snap": 1000}}
# another connection:
> {"cmd": "update", "collection": "accounts", "query": {"name": "alice"}, "update": {"$set": {"balance": 0}}}
< {"ok": true, "data": {"modified": 1}}
> {"cmd": "insert", "collection": "accounts", "doc": {"name": "carol", "balance": 500}}
< {"ok": true, "data": {"id": 3}}
# the first connection:
> {"cmd": "find", "collection": "accounts", "query": {}}
< {"ok": true, "data": [{"name": "alice", "balance": 0, "_id": 1, "_version": 4}, {"name": "bob", "balance": 85, "_id": 2, "_version": 3}, {"name": "carol", "balance": 500, "_id": 3, "_version": 1}]}
> {"cmd": "snapshot_find", "collection": "accounts", "snap": 1000, "query": {}}
< {"ok": true, "data": [{"_id": 1, "_version": 3, "balance": 20, "name": "alice"}, {"name": "bob", "balance": 85, "_id": 2, "_version": 3}]}
> {"cmd": "snapshot_aggregate", "collection": "accounts", "snap": 1000, "pipeline": [{"$group": {"_id": null, "total": {"$sum": "$balance"}}}]}
< {"ok": true, "data": [{"_id": null, "total": 105}]}
> {"cmd": "aggregate", "collection": "accounts", "pipeline": [{"$group": {"_id": null, "total": {"$sum": "$balance"}}}]}
< {"ok": true, "data": [{"_id": null, "total": 585}]}
> {"cmd": "snapshot_end", "snap": 1000}
< {"ok": true, "data": "snapshot closed"}
Inside the snapshot Alice's update is rolled back and Carol does not exist. Snapshots expire after OXIDB_SNAPSHOT_MAX_SECS (default 300). A snapshot held open forever is a bloat bug by definition, and the ceiling turns it into a SnapshotExpired error for the reader instead of stalling writers.
The ADR says why I did not build full MVCC. Full MVCC does not complement OCC, it replaces it. It brings vacuum-class bloat problems and charges the index-versioning price everywhere instead of only while a snapshot is active. This engine's most valuable property is that its guarantees are small enough to crash-test exhaustively, and I wanted to keep that.
Change streams and realtime
The watch command turns a connection into a change stream, optionally limited to one collection. Every event has an increasing token. Inserts and updates carry the new document, deletes the old one, and events from a transaction also carry its tx_id:
W< {"event":"change","data":{"token":1,"operation":"update","collection":"accounts","doc_id":1,"document":{"name":"alice","balance":70,"_id":1,"_version":2},"tx_id":1}}
W< {"event":"change","data":{"token":2,"operation":"update","collection":"accounts","doc_id":2,"document":{"name":"bob","balance":80,"_id":2,"_version":2},"tx_id":1}}
W< {"event":"change","data":{"token":3,"operation":"update","collection":"accounts","doc_id":1,"document":{"name":"alice","balance":20,"_id":1,"_version":3},"tx_id":2}}
W< {"event":"change","data":{"token":4,"operation":"update","collection":"accounts","doc_id":2,"document":{"name":"bob","balance":85,"_id":2,"_version":3},"tx_id":5}}
The conflicting transaction (tx 3) and the rolled-back one (tx 4) never appear in the stream, which follows from events being published after the commit point. If the connection drops, resume_after picks up where it left off; the server keeps the last 4096 events in a replay buffer (OXIDB_CHANGE_REPLAY_EVENTS):
> {"cmd": "watch", "collection": "accounts", "resume_after": 3}
< {"ok": true, "data": "watching"}
W< {"event":"change","data":{"token":4,"operation":"update","collection":"accounts","doc_id":2,"document":{"name":"bob","balance":85,"_id":2,"_version":3},"tx_id":5}}
The same stream is available over WebSocket (OXIDB_WS_PORT, {"cmd": "subscribe", "id": "sub1", "collection": ..., "query": ...}), with JWT authentication and row-level security rules evaluated per document.
REST and PostgREST
There are two HTTP surfaces. The first is a plain JSON REST API:
$ curl -s -X POST localhost:15106/api/products/documents -H "Content-Type: application/json" -d '{"doc":{"sku":"SP-01","name":"Speaker","price":120,"tags":["bluetooth"]}}'
{"id":6}
$ curl -s -X POST localhost:15106/api/orders/aggregate -H "Content-Type: application/json" -d '{"pipeline":[{"$match":{"customer":"c42"}},{"$group":{"_id":"$status","n":{"$sum":1}}},{"$sort":{"n":-1}}]}'
[{"_id":"paid","n":18},{"_id":"shipped","n":9},{"_id":"cancelled","n":7}]
The second is a PostgREST-compatible surface (ADR-0019). /rest/v1/{table} speaks PostgREST's URL grammar, so clients like @supabase/postgrest-js work unmodified, and the same URL can reach a document collection, a SQL table or a time series:
$ curl -s "localhost:15106/rest/v1/orders?customer=eq.c42&status=eq.paid&select=order_no,amount,created&order=amount.desc&limit=3"
[{"order_no":7782,"amount":456,"created":"2026-03-14T02:27:01Z"},{"order_no":1028,"amount":444,"created":"2026-04-28T19:05:23Z"},{"order_no":15018,"amount":443,"created":"2026-01-10T02:27:44Z"}]
$ curl -s "localhost:15106/rest/v1/products?or=(price.lt.20,price.gt.200)&select=sku,price"
[{"sku":"MN-27","price":224.1},{"sku":"CB-10","price":8.1}]
Without OXIDB_JWT_SECRET the REST API is open with no authentication, and the server prints a warning about it at startup. In production you want JWT or a private network.
Multiple databases (ADR-0012)
One process can host several databases, each in its own directory (data/oxidb, data/tenant_a, ...). A database covers both the document namespace and the SQL namespace, reached by the same name. Every request can carry a db field, or the session can switch with use_db:
> {"cmd": "create_database", "name": "tenant_a"}
< {"ok": true, "data": "database 'tenant_a' created"}
> {"cmd": "insert", "collection": "orders", "db": "tenant_a", "doc": {"order_no": 1, "amount": 42}}
< {"ok": true, "data": {"id": 1}}
> {"cmd": "list_databases"}
< {"ok": true, "data": ["oxidb", "postgres", "tenant_a"]}
> {"cmd": "use_db", "name": "tenant_a"}
< {"ok": true, "data": "switched to database 'tenant_a'"}
> {"cmd": "count", "collection": "orders"}
< {"ok": true, "data": {"count": 1}}
> {"cmd": "use_db", "name": "oxidb"}
< {"ok": true, "data": "switched to database 'oxidb'"}
> {"cmd": "count", "collection": "orders"}
< {"ok": true, "data": {"count": 20000}}
postgres is an alias of the default database for PostgreSQL wire clients. A session's open transaction is bound to the database it started on, and a request to another database is rejected until commit. Raft replication carries database DDL and scoped writes too. Cross-database queries and transactions are deliberately out of scope.
Blobs
The document engine also carries a small object store: buckets, keys, a content type and metadata. Good for invoices, attachments, small files:
> {"cmd": "put_object", "bucket": "invoices", "key": "2026/10/INV-1001.txt", "data": "SW52b2ljZSAxMDAxOiAzIHgga2V5Ym9hcmQ=", "content_type": "text/plain", "metadata": {"customer": "c42"}}
< {"ok": true, "data": {"key": "2026/10/INV-1001.txt", "bucket": "invoices", "size": 26, "content_type": "text/plain", "etag": "2d01298f4acb19ac183c86e3fbe43e3d", "created_at": "2026-10-11T21:36:35Z", "metadata": {"customer": "c42"}, "stored_size": 26, "format_version": 1}}
Text inside blobs (PDF, DOCX, HTML and more) can also feed full-text search. The surface that speaks to real S3 clients is a separate topic: the S3 object storage post.
Limits and honest trade-offs
- Pre-1.0. The disk format, the wire protocol and the query language can change between releases with no migration path. Pin a version, and dump and reload on upgrade.
- Array equality is not MongoDB's.
{"tags": "usb"}does not look inside the array; use$allor$elemMatch. - Phantoms and predicate constraints. Transactions are serializable over the documents they read, not over predicates. Plain
find/countare read-committed. Useaggregateor an explicit snapshot for a consistent view. - No reading your own writes inside a transaction. Writes compose at commit.
- Single, concurrent, strict writes into one collection do not scale. Batch them or group them in transactions.
- Index intersection is expensive with unselective indexes. Prefer composite indexes for low-cardinality fields.
- There is a resident floor. The offset index grows with document count, and large result sets are still materialized in memory; streaming result frames are designed in ADR-0026.
$filland$densifytake different partition keys, and unknown keys are silently ignored.
How it fits with the rest of OxiDB
The document engine is the ground the rest of OxiDB stands on. The WAL, the commit log, encryption, backup and point-in-time recovery use its machinery. Log ingestion collections and their TTL-based retention are its collections. Full-text and vector indexes and the geospatial and graph stages run in its pipeline. The SQL and time series engines are deliberately separate engines with separate files, but they live in the same process, under the same security model and the same database selector, all in one binary.
Trying it
Binaries are on GitHub releases: github.com/parisxmas/OxiDB/releases (macOS arm64/x86_64, Linux x86_64/arm64, Windows). Download, unpack and run:
tar xzf oxidb-server-*.tar.gz
./oxidb-server
With Docker, docker compose up -d is enough. By default it listens on 127.0.0.1:4444 and writes to ./oxidb_data/. You can try the requests in this post as they are with the short Python client above. The next post in the series is full-text and vector search, which runs on these same collections.