OxiDB Ledger Engine: fixed-width streams for order and fill journals
The oxidb-ledger crate I wrote for exchange journals: 40-byte fixed records, engine-assigned sequences, mmapped segments, retention by deleting files and per-stream fsync. With real measurements and two bugs I found.
Every engine in this series so far lives inside a running server, behind a port number. The one in this post does not. oxidb-ledger is a young crate that sits in the OxiDB repository with its own tests, but it has not been added to the workspace yet and nothing calls it. The 0.44.2 server has no environment variable or wire command that turns it on. I still gave it a post, because the most interesting design decisions from putting OxiDB behind an exchange are in here, and the engine itself is small: three files, about 1650 lines of Rust. Below I explain why I wanted a separate engine, how a record is laid out byte by byte, and how segments, retention, fsync and the read path work. Since the server does not expose it, I ran every example on my own machine through a small Rust project that mounts the crate's source files without changing them. All the output is real. Along the way I found two bugs, and I cover those near the end without hiding anything.
Why a separate engine?
When I positioned OxiDB as the data layer of a crypto or securities exchange, docs/exchange-readiness.md drew a line up front: the matching engine is not the database's job. Real exchanges match orders in a single-threaded, in-memory event loop (the LMAX model). OxiDB is the durable, consistent layer behind it: order, trade and journal persistence, the balance ledger, market data, and idempotent request handling.
Today that layer is built on the document engine and its transactions. The tests/live-exchange example in the repo runs a real exchange with ten trader processes and one matcher per symbol. Each fill (the part of an order that actually executed against another order) settles in one atomic transaction: it moves USD and the asset between the two users, inserts the trade, writes the double-entry journal, and sets the symbol's price to the last trade. A verify step then checks that no money was created, that the journal balances, and that every balance can be rebuilt from the journal. According to its README, this setup runs about 150 trades per second on a laptop in lazy-sync mode.
That is the right tool for the balance ledger. A transfer changes several documents together and needs isolation. But an exchange keeps two other records, and they have a very different shape:
- The order journal: an immutable record of every accepted order. An acknowledgement only means something if this record is on disk.
- The fill journal: a record of every match: who traded with whom, at what price, in what size.
What these two have in common: they are append-only, never updated, their shape has not changed since open outcry, their order is sacred, and old parts of them are thrown away in bulk after a while. Put this workload on a general-purpose structure (a B-tree, a document store, a SQL table) and you pay three costs:
- Append cost grows with history. Inserting into a B-tree means keeping a structure that spans the whole history up to date.
- Every record gets encoded. Document or row encoding, field names, length prefixes, an allocation per record.
- Retention is a scan and a rewrite. "Delete a month" means finding every row in that month, deleting it and updating the indexes.
oxidb-ledger was written to remove all three by design. The crate's description says it in one line: "append-only fixed-width streams with segment retention, for order and fill journals".
Status: in the code, not in the server
Let me be upfront, because this differs from the rest of the series:
- The crate landed in a single commit dated 7 September 2026. The commit message is explicit: "A new crate, not yet in the workspace and not referenced by anything."
oxidb-ledger/srchasschema.rs,segment.rsandlog.rs, but nolib.rs. The rootCargo.tomldoes not list it as a member andoxidb-serverdoes not depend on it.- The word "ledger" does not appear once in the 0.44.2 server binary (
strings oxidb-server | grep -ci ledgerprints 0). Nothing in the wire protocol, REST, or the PostgreSQL-compatible port exposes it.
The comments in the source show where it is headed, though. Field kind discriminants are defined as "the wire encoding", a schema is said to "cross the socket as these bytes", and verify is described as "what a verify command runs". The target is a wire surface where the client sends records over the socket in exactly the bytes that will be written. That surface has not been written yet.
So I mounted the engine as modules from a separate Cargo project, without touching the repository's files:
// harness/src/lib.rs
// oxidb-ledger ships three modules and no lib.rs yet. This mounts the repo's
// files unchanged as modules of one library, so crate::schema and
// crate::segment resolve as they would in the real crate.
#[path = "../OxiDB/oxidb-ledger/src/schema.rs"]
pub mod schema;
#[path = "../OxiDB/oxidb-ledger/src/segment.rs"]
pub mod segment;
#[path = "../OxiDB/oxidb-ledger/src/log.rs"]
pub mod log;
The dependencies match the crate's own Cargo.toml: crc32fast, memmap2, and tempfile for tests. With this setup the crate's own unit tests run too, and I come back to their result below.
Data model: stream, record, sequence
The engine has one concept: the stream. A stream is a named sequence of records with its own directory under a root, and its schema is fixed the moment it is created. Think of two streams on an exchange, orders and fills.
Fixed width, fixed layout
Every record in this engine has a fixed width and a fixed layout. That is the basis of the whole design: an append is a copy_from_slice into a buffer that already has room, and a scan is a walk down memory with a known stride. No row encoding, no per-field length prefix, no per-record allocation, and nothing to parse on either the write or the read path.
The price is the flexibility a document store gives you: a record cannot grow a field, and a field cannot be absent. For an order journal and a fill journal that is no loss. I like the comment in the source: a venue that changes the shape of a fill has a migration on its hands whatever the storage engine does.
There are eight field kinds: I8, U8, I16, U16, I32, U32, I64, U64. A stream can declare up to 16 fields on top of seq and ts. That is not a storage limit but a query limit: predicates will be held in a fixed array so evaluating them allocates nothing. A record can be at most 4 KiB wide; the ceiling stops a schema arriving off a socket from asking for a segment of unbounded size.
Two mandatory fields
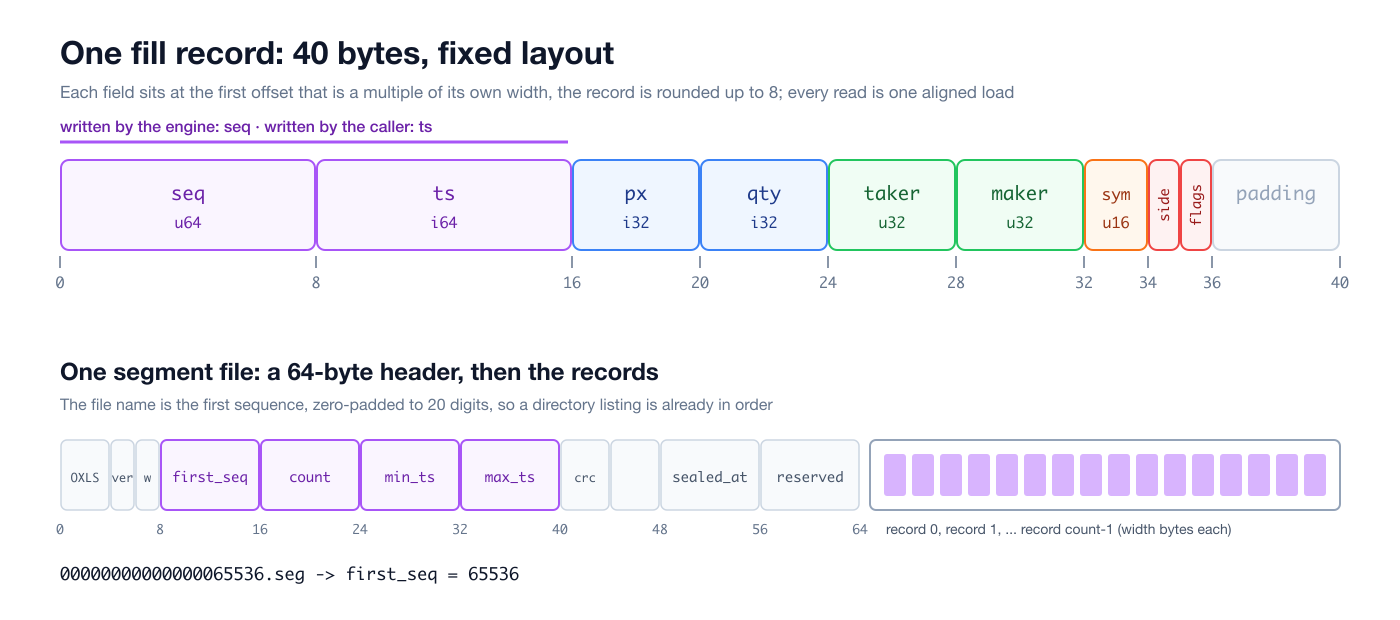
Every record starts with a u64 sequence (seq, offset 0) and an i64 timestamp (ts, offset 8). They are not declared; the engine reserves them. The division of labour:
- The engine assigns sequences, never the caller. A sequence is the venue's own statement about order: "this fill happened before that one." A client that could pick its own could not be held to it. Sequences are dense and monotonic within a stream, so a gap means a lost record and is worth reporting rather than tolerating.
- The caller supplies the timestamp, because only the caller knows it. A market stamps a fill at the microsecond it matched, which is earlier than when the batch reaches the engine, and it is the number anyone analysing the tape actually wants.
Everything reads as i64
A field is stored at its declared width but read sign- or zero-extended into an i64. That is one load either way, and it means a predicate, an aggregate and a projection all work in one type instead of eight. The cost is that a u64 above i64::MAX reads negative; no field in a ledger is one.
On write, a value that does not fit is refused, not truncated. That is the same choice the SQL engine makes for declared integer widths, for the same reason: a silently wrapped account number is a wrong answer that looks like a right one.
Packing rule and two built-in shapes
After seq and ts, each field goes at the next offset that is a multiple of its own width, and the record is rounded up to eight. Every read is a single aligned load and an array of records stays aligned. Declare fields widest first and no padding is wasted.
The crate ships two shapes, shapes::fill() and shapes::order(). A fill is px (price, i32), qty (i32), taker and maker (the two parties, u32), sym (symbol, u16), side (u8) and flags (u8).
The schemas' Debug output from my run:
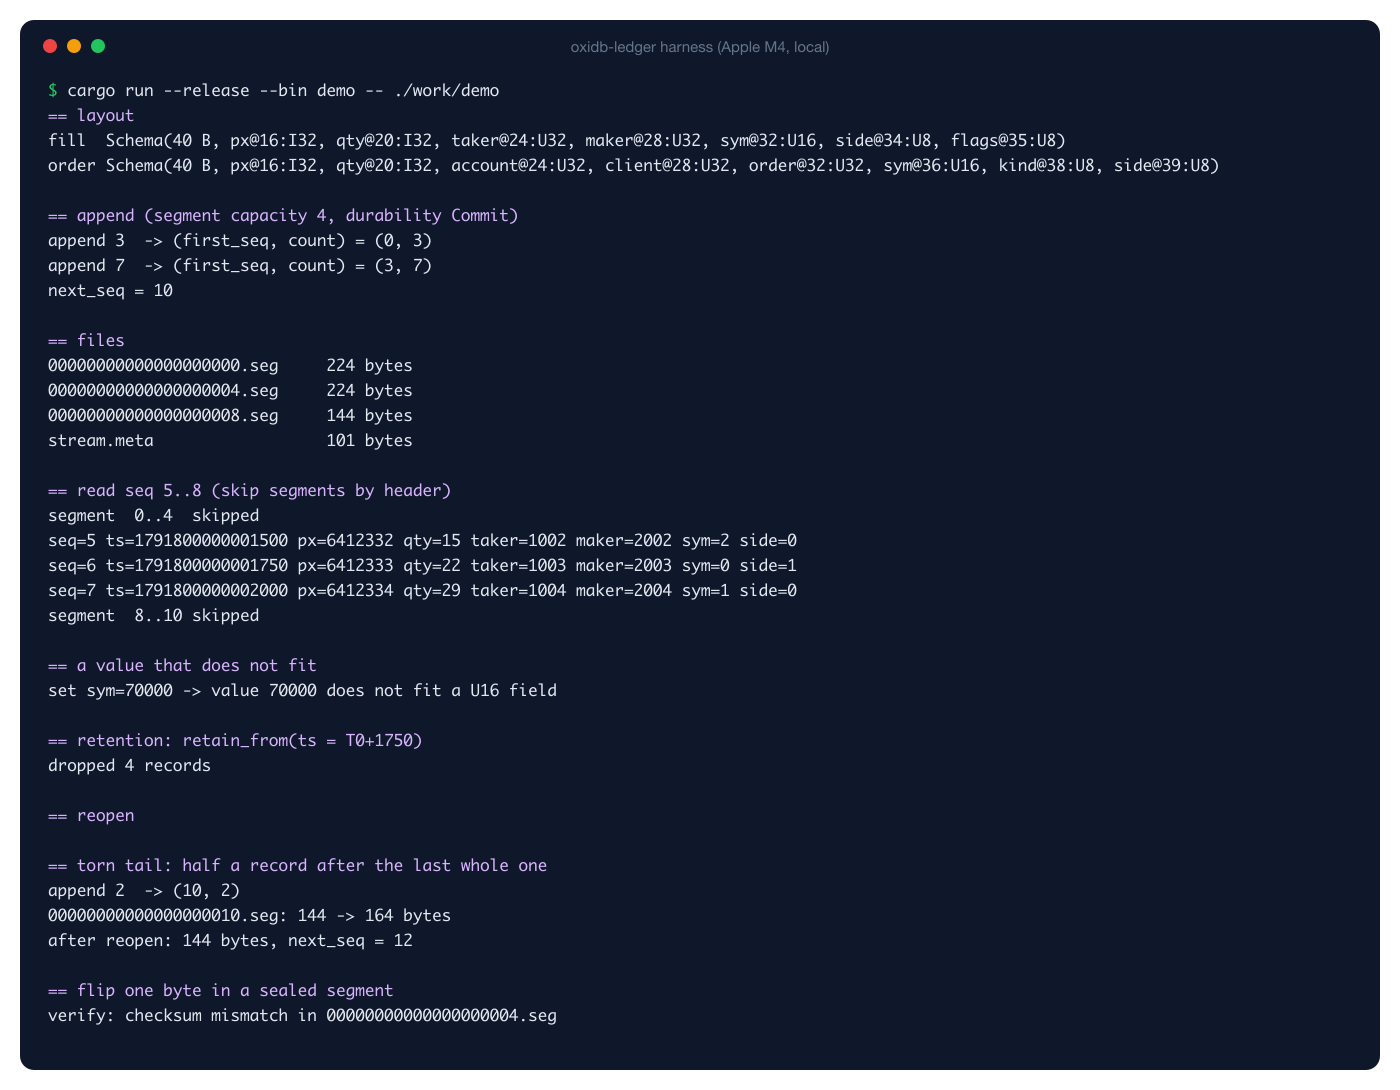
== layout
fill  Schema(40 B, px@16:I32, qty@20:I32, taker@24:U32, maker@28:U32, sym@32:U16, side@34:U8, flags@35:U8)
order Schema(40 B, px@16:I32, qty@20:I32, account@24:U32, client@28:U32, order@32:U32, sym@36:U16, kind@38:U8, side@39:U8)
A fill is 40 bytes, so a million fills is 40 MB. The order record also comes out at 40 bytes; more on that later, because the crate's own test expects 48.
The price being an i32 is deliberate: prices are stored as integer ticks (in my examples 1/100 units, so 6412350 is 64123.50). Never keeping money in floating point is the first rule of anything that keeps books.
Using it: the Rust API
With no wire surface, the Rust API is the only way to use the engine today. Creating a stream:
use ledger_harness::log::{Durability, Stream, DEFAULT_CAPACITY};
use ledger_harness::schema::{Schema, shapes};

let s = shapes::fill();
let mut st = Stream::create(root, "fills", s, DEFAULT_CAPACITY, Durability::Commit)?;
Appending takes an n * width byte buffer the caller has already laid out. The engine writes the sequence it assigns into the first eight bytes of each record, leaves everything else alone, and returns the first sequence and the count:
let w = s.width();
let mut buf = vec![0u8; 3 * w];
for (i, r) in buf.chunks_exact_mut(w).enumerate() {
    Schema::put_ts(r, t0 + i as i64 * 250);   // the caller's timestamp
    s.set(r, 0, 6_412_350)?;                  // px
    s.set(r, 1, 15)?;                         // qty
}
let (first_seq, count) = st.append(&mut buf)?;
I ran my demo with segment capacity cut to 4 records so the boundaries show up in a small example:
The first two appends return (0, 3) and (3, 7): the engine hands out the numbers and carries on where it left off. The second batch of 7 crosses the 4-record boundary twice and is split rather than refused:
== append (segment capacity 4, durability Commit)
append 3  -> (first_seq, count) = (0, 3)
append 7  -> (first_seq, count) = (3, 7)
next_seq = 10
Stats { records: 10, segments: 3, bytes: 592, first_seq: 0, next_seq: 10, min_ts: 1791800000000000, max_ts: 1791800000002500, appended: 10, dropped: 0 }

== files
00000000000000000000.seg     224 bytes
00000000000000000004.seg     224 bytes
00000000000000000008.seg     144 bytes
stream.meta                  101 bytes
A record may not straddle two segments, so append cuts the batch into as many pieces as there are segments to put it in: one piece for a batch smaller than a segment, two for a batch that happens to cross a boundary.
And the refusal of a value that does not fit is real:
== a value that does not fit
set sym=70000 -> value 70000 does not fit a U16 field
Segments: the unit of everything cheap
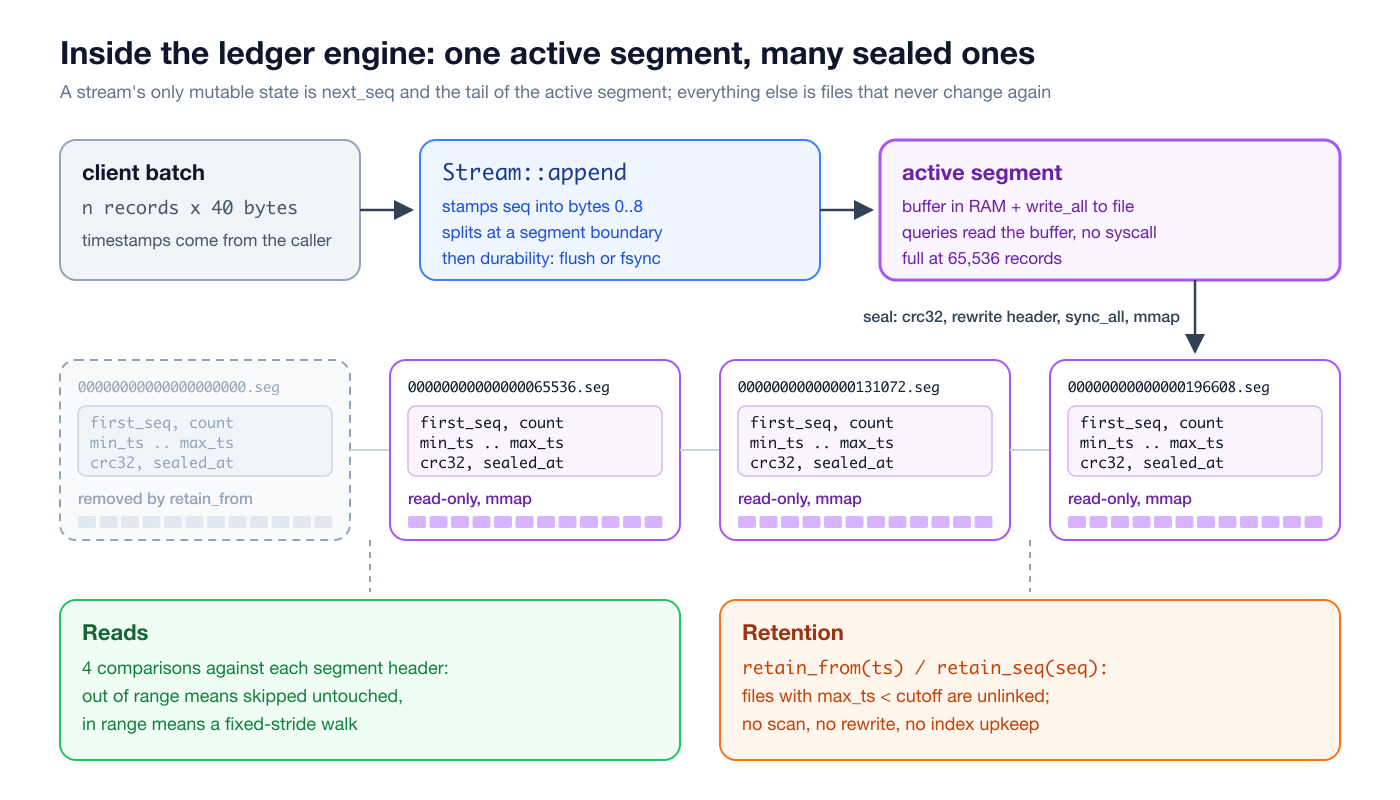
A segment is a file: a header followed by fixed-width records. It is written once, front to back, and never modified. When it reaches its record count it is sealed: the header is completed, the file is synced and mapped. From then on it is read-only bytes the kernel can page in and out without the engine knowing.
File name and header
A segment's file name is the sequence it starts at, zero-padded to 20 digits, so the directory lists in order without anybody parsing anything. The header is 64 bytes:
| Offset | Field | Meaning |
|---|---|---|
| 0 | magic OXLS | OxiDB ledger segment |
| 4 | version | currently 1 |
| 6 | width | record width |
| 8 | first_seq | sequence of the first record |
| 16 | count | record count (0 until sealed) |
| 24 | min_ts | least timestamp observed |
| 32 | max_ts | greatest timestamp observed |
| 40 | crc | CRC32 of the record bytes |
| 48 | sealed_at | wall clock at sealing (ms) |
The first 104 bytes of a segment from the demo directory, through xxd:
00000000: 4f58 4c53 0100 2800 0800 0000 0000 0000  OXLS..(.........
00000010: 0200 0000 0000 0000 ca38 82f2 a15d 0600  .........8...]..
00000020: c439 82f2 a15d 0600 a64c ef3c 0000 0000  .9...]...L.<....
00000030: 8a27 eb2c a101 0000 0000 0000 0000 0000  .'.,............
00000040: 0800 0000 0000 0000 ca38 82f2 a15d 0600  .........8...]..
00000050: 2fd8 6100 2400 0000 ed03 0000 d507 0000  /.a.$...........
00000060: 0200 0100 0000 0000 ........OXLS, version 1, width 0x28 = 40, first_seq 8, count 2, then min_ts, max_ts, CRC and sealed_at. From byte 64 the first record begins: seq 8, ts, price 0x61d82f = 6412335, quantity 0x24 = 36, taker 1005, maker 2005, sym 2, side 1. No parser, because there is nothing to parse.
sealed_at has its own reason to exist: retention by age of the record uses max_ts, while sealed_at is for retention by age of the write. That is a different question, and one an operator asks when the records' own timestamps cannot be trusted.
The active segment
The segment being written goes to the file and is kept in memory as well. The two answer different questions: the file is what survives, the buffer is what a query reads without a syscall. At the default capacity of 65,536 forty-byte records that buffer is 2.6 MB, and it is the only memory the engine holds per stream that is not a mapped file.
The source explains the default: a 2.6 MB file is small enough for fine-grained retention (an operator asking to keep the last minute gets the last minute, not the last hour), and large enough that sealing, the one place an append does real work, happens twice a second at 35,000 records a second rather than constantly.
Why append cost stays flat
A stream's entire mutable state is next_seq and the tail of the active segment. Everything else is files that will not change again. There is no structure spanning the history to keep up to date. In code, an append does this: stamp the sequences, one extend_from_slice, one write_all, a second pass over bytes still hot in L1 to track min and max timestamp, then flush or fsync depending on durability. None of that looks at how many segments came before.
I tried to measure that too, and I need to be honest about the result; the details are in the performance section below.
Opening
Reopening a stream does not read a single record of a sealed segment. It reads each 64-byte header, maps the rest, and replays only the last, unsealed segment. A stream of 10 million records in 153 segments opened in about 25 ms on my machine.
Durability: three settings per stream
Durability is chosen per stream, because the two journals want different answers:
| Setting | Meaning |
|---|---|
Durability::Os | Hand the bytes to the OS and carry on. A process crash loses nothing; a machine crash loses what the page cache had not written. |
Durability::Sealed | Reach the disk when a segment seals, no more often. The window is one segment. |
Durability::Commit | Reach the disk before append returns. This is what an acknowledgement waits on. |
The reasoning in the source: a fill journal can afford to lose the last few milliseconds to a power cut, because the fills are also on the wire, in the browser and in the time series. An order journal cannot: its whole point is that an acknowledgement means the order survives, and that is only true if the write reached the disk before the acknowledgement left.
That is the same posture as the rest of OxiDB, which by default fsyncs the WAL and the commit log on every commit (see the document engine post). Sealing always ends with sync_all, so a sealed segment is on disk whatever the setting.
What I measured (Apple M4 Mac, internal SSD, macOS, each configuration for 3 seconds or up to a record cap):
Os      batch     1:    1443154 records in   3.00 s =      481051 rec/s,       2.1 us/append call
Os      batch    16:    4000000 records in   1.99 s =     2014745 rec/s,       7.9 us/append call
Os      batch   256:    4000000 records in   1.49 s =     2683801 rec/s,      95.4 us/append call
Os      batch  4096:    4001792 records in   0.62 s =     6440016 rec/s,     636.0 us/append call
Sealed  batch     1:    1481627 records in   3.00 s =      493876 rec/s,       2.0 us/append call
Sealed  batch    16:    4000000 records in   1.72 s =     2320832 rec/s,       6.9 us/append call
Sealed  batch   256:    4000000 records in   1.12 s =     3571360 rec/s,      71.7 us/append call
Sealed  batch  4096:    4001792 records in   0.69 s =     5761754 rec/s,     710.9 us/append call
Commit  batch     1:        733 records in   3.00 s =         244 rec/s,    4094.0 us/append call
Commit  batch    16:      11648 records in   3.00 s =        3881 rec/s,    4123.0 us/append call
Commit  batch   256:     161024 records in   3.00 s =       53622 rec/s,    4774.2 us/append call
Commit  batch  4096:     401408 records in   0.52 s =      770586 rec/s,    5315.4 us/append call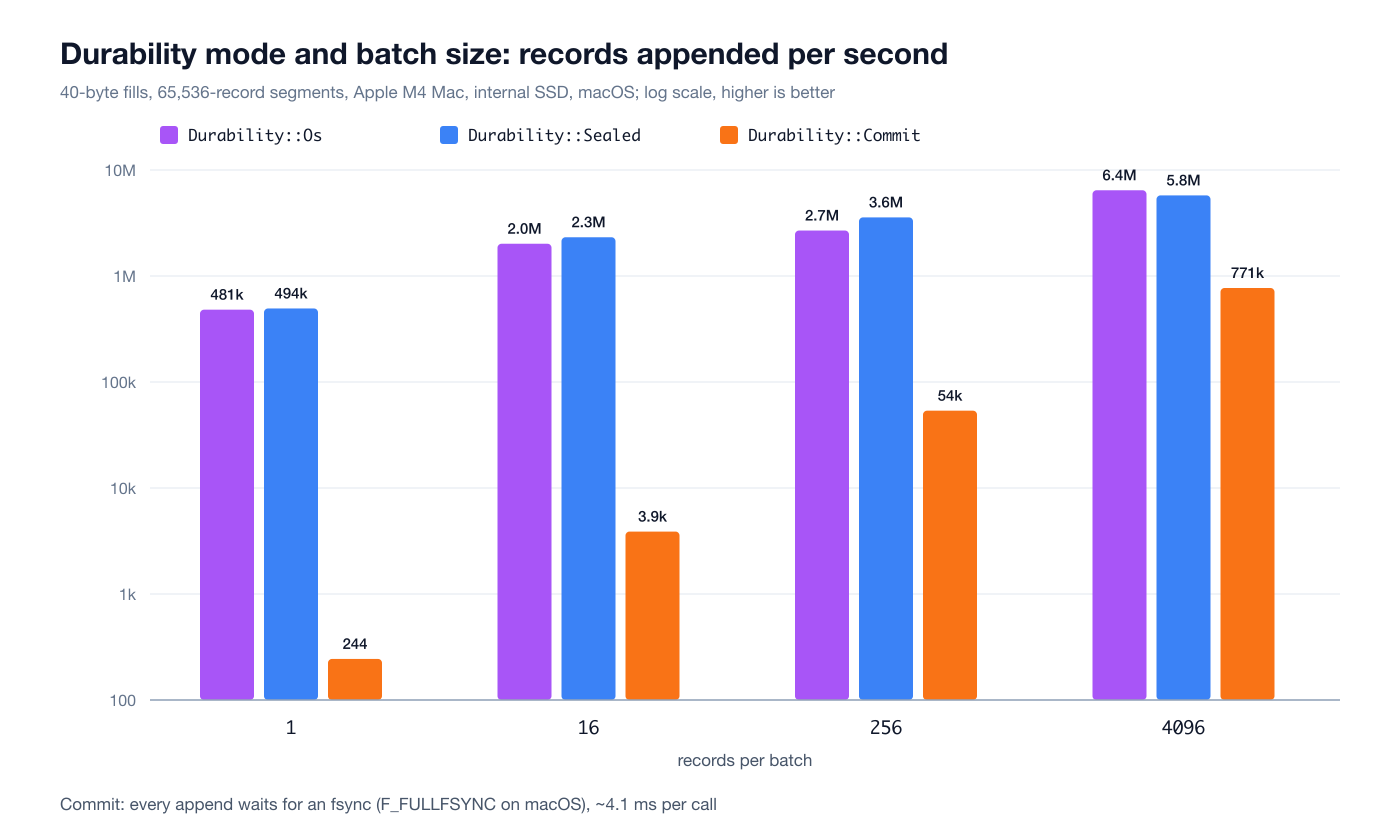
The story is clear:
- In
Commitmode each call costs about 4.1 ms. That is not the engine; it isF_FULLFSYNC, which Rust'ssync_datauses on macOS to make the drive flush its own write cache. With one record per batch that means 244 records a second. - Spreading the same fsync over more records changes everything: with 4096-record batches
Commitreaches 770,000 records a second. That is group commit in its purest form, and it explains why the wire surface is designed around the client sending bytes in batches. OsandSealedcost microseconds per call. Why the two come out nearly identical is something I return to in the "what I found" section.
Reads: by sequence, by time, full scans
The crate has no query language or predicate evaluator yet; the 16-field limit in the schema file is reserved for it. What exists today is the foundation of reading: segments() yields every segment, oldest first, as a header plus the bytes it describes. Nothing is copied and nothing is decoded. For sealed segments the bytes are the mmap itself; for the active segment they are the in-memory buffer.
Deciding whether a segment is worth reading is four comparisons against its header:
pub fn holds_seq(&self, from: u64, to: u64) -> bool {
    self.count > 0 && self.first_seq < to && self.end_seq() > from
}
pub fn holds_ts(&self, from: i64, to: i64) -> bool {
    self.count > 0 && self.min_ts < to && self.max_ts >= from
}
Ranges are half-open everywhere. Because holds_ts works on the observed least and greatest timestamps rather than the first and last record, a segment whose records arrived out of order still answers correctly.
In the demo, reading sequences 5..8 skips the first and last segment by header alone:
== read seq 5..8 (skip segments by header)
segment  0..4  skipped
seq=5 ts=1791800000001500 px=6412332 qty=15 taker=1002 maker=2002 sym=2 side=0
seq=6 ts=1791800000001750 px=6412333 qty=22 taker=1003 maker=2003 sym=0 side=1
seq=7 ts=1791800000002000 px=6412334 qty=29 taker=1004 maker=2004 sym=1 side=0
segment  8..10 skipped
Because sequences are dense, finding one record inside a segment does not even need a search: it is at (seq - first_seq) * width. Reading a single record by sequence from a 10-million-record stream took 2.1 microseconds:
== one record by sequence
seq 7654321 ts 1791807654321000 px 6412331 qty 48 in 2.1 us
Time ranges work the same way. Asking for one minute out of 10 million fills spanning about 2.8 hours of market time skipped 151 of 153 segments by header:
== one minute out of ~2.8 hours, by timestamp
60000 records, volume 1530000; segments read 2, skipped 151; 0.166 ms
And a full scan: volume-weighted average price over all 10 million records. Records are walked at a fixed stride, each field is a single load:
== full scan: VWAP and volume over every record
cold-ish 10000000 records, volume 255000000, vwap 64123.4959, 48.4 ms = 207 M rec/s, 8.26 GB/s
warm     10000000 records, volume 255000000, vwap 64123.4959, 33.1 ms = 302 M rec/s, 12.09 GB/s
300 million records a second on one thread with a warm page cache. I say "cold-ish" because the files had just been written and most of them were still cached; a truly cold read from disk would be slower.
Retention: deleting files
Retention is my favourite part of the engine because it does almost nothing. retain_from(cutoff) removes every sealed segment whose max_ts is below the cutoff. No scan, no rewrite, no index maintenance: one remove_file per segment. retain_seq(cutoff) does the same by sequence, for callers who keep "the last N records" rather than "the last N minutes".
A few details matter:
- The test is each segment's own
max_ts, not its position. A stream whose clock stepped backwards drops exactly what it should. - The active segment is never touched however old its records are, because it is still being written. A stream that has gone quiet keeps its last partial segment until something else arrives to seal it.
- Retention removes history, it does not renumber it.
next_seqcarries on andfirst_seqmoves up.
The demo:
== retention: retain_from(ts = T0+1750)
dropped 4 records
Stats { records: 6, segments: 2, bytes: 368, first_seq: 4, next_seq: 10, min_ts: 1791800000001250, max_ts: 1791800000002500, appended: 10, dropped: 4 }

== reopen
Stats { records: 6, segments: 2, bytes: 368, first_seq: 4, next_seq: 10, min_ts: 1791800000001250, max_ts: 1791800000002500, appended: 10, dropped: 4 }
durability = Commit, verify failures = 0
Note that the cutoff is T0+1750 but only 4 records went. Retention works at segment granularity: the 4..8 segment's max_ts is above the cutoff, so its record at 1250 stays too. The guarantee is "keep at least this", not "delete exactly this".
At scale: dropping the first half of the 10-million-record stream took between 54 and 127 ms across three runs:
== retention: drop the first half by time
dropped 4980736 records in 54.25 ms
Stats { records: 5019264, segments: 77, bytes: 200775488, first_seq: 4980736, next_seq: 10000000, ...
According to a comment in the source, one trigger for writing this engine was a DELETE over three million rows in the SQL engine taking 8.7 seconds and blocking. That is not something I can reproduce today: the SQL engine's DML path has been rewritten since ("DML is one scan, ids only", just before 0.44.2). For comparison I loaded the same fills into the two engines the 0.44.2 server does expose (on port 16000, OXIDB_SQL=1, default full durability) and asked the same retention question. With the Python client and 1 million records:
db.sql("CREATE TABLE fills (seq BIGINT PRIMARY KEY, ts BIGINT, px INTEGER, qty INTEGER, "
       "taker INTEGER, maker INTEGER, sym INTEGER, side INTEGER)")
# 1000-row INSERTs, each inside BEGIN/COMMIT ...
db.sql(f"DELETE FROM fills WHERE ts < {cut}")

# document engine: insert_many in thousands, with an index on ts
db.create_index("fills", "ts")
db.delete("fills", {"ts": {"$lt": cut}})
ping: pong
sql insert 1000000 rows (1000/stmt): 11.15 s = 89660 rows/s
sql count: [[1000000]]
sql DELETE WHERE ts < cutoff: {'affected': 500000} in 381 ms
doc insert_many 1000000 docs (1000/call): 10.15 s = 98511 docs/s
doc delete ts < cutoff: {'deleted': 500000} in 2011 ms
doc count: 500000| Method | Records removed | Time |
|---|---|---|
SQL engine, DELETE WHERE ts < ... | 500,000 | 381 ms |
Document engine, delete {ts: {$lt: ...}} | 500,000 | 2011 ms |
Ledger, retain_from (76 files) | 4,980,736 | 54 - 127 ms |
This is not a race and should not be read as one: the SQL and document engines find each row and durably log its removal, update indexes and give concurrent readers a consistent view, and the server numbers include the network and JSON path. The real difference is the shape of the cost: in the SQL and document engines retention scales with the number of rows removed; in the ledger it scales with the number of files. Ten times the records is not a ten times longer delete, just ten times more unlink calls.
Crash recovery and integrity
The torn tail
When an active segment is created its header is written with a record count of zero and only rewritten at seal. So a file that was being appended to when the process died is recognisable by its zero count, and it is replayed rather than trusted. A process that dies mid-write leaves a partial record at the end. That tail is neither an error nor corruption; it is a write that never happened. It is truncated away and the segment carries on from the last whole record, the same treatment the document engine's WAL gives a torn tail.
In the demo I appended 20 bytes of garbage (half a record) to the active segment and reopened:
== torn tail: half a record after the last whole one
append 2  -> (10, 2)
00000000000000000010.seg: 144 -> 164 bytes
after reopen: 144 bytes, next_seq = 12
The file was cut back to 144 bytes, both whole records survived, next_seq is 12.
CRC32
Every sealed segment carries a CRC32 of its record bytes in its header. It is not on any hot path; verify() is what an operator or a crash test runs. Flipping one bit in a sealed segment is caught:
== flip one byte in a sealed segment
verify: checksum mismatch in 00000000000000000004.seg
Performance: what I measured and what I could not
All numbers are from an Apple M4 Mac with 24 GB of RAM, internal SSD, macOS; single thread, 40-byte fills, Durability::Os, 1024-record batches.
| Measurement | Result |
|---|---|
| Appending 10 million fills (3 runs) | 2.29 / 2.60 / 4.03 s, i.e. 2.5 to 4.4 million records/s (99 to 175 MB/s) |
| Opening a 153-segment stream | 25 - 26 ms |
| VWAP scan over 10 million records | 33 ms warm (~300 million records/s) |
| One minute out of 2.8 hours, by time | 0.17 ms, 151 of 153 segments skipped |
| One record by sequence | 2.1 µs |
| Dropping the first half by retention | 54 - 127 ms, 4.98 million records |
Now the part I have to be honest about. The claim in the source is that a stream with a hundred million records behind it appends at exactly the rate a stream with ten thousand does. At the code level that is true: no step of an append looks at the size of the history. But I could not measure it cleanly on my machine. In the 10-million runs, the rate per million ranged from 1.4 to 10.4 million records a second, and later millions were usually slower. To isolate it I ran a separate experiment: write 0, 3, 6 or 9 million records of history, sync, pause, reopen the stream and append 1 million more. Results for the same configuration ranged from 166 thousand to 10.6 million records a second; the empty stream was faster on average, but the spread was too wide in every case to pin the difference on history. During these runs the disk had only about 2 GB free, and the behaviour of APFS and the SSD at that fill level drowns out the work the engine does. So read "history does not affect append cost" as a property of the design, not as my measurement. Repeating this on Linux, on an empty disk, with perf separating the CPU side, is on my list.
What I found: two bugs and a gap
Preparing this post was the first time I really drove the crate, and three things came out. All of them confirm what its absence from the workspace already says: this engine is not finished.
1. A test is wrong. 18 of the crate's 19 tests pass. The remaining one is an_order_is_forty_eight_bytes:
test schema::tests::an_order_is_forty_eight_bytes ... FAILED
assertion `left == right` failed
  left: 40
 right: 48
test result: FAILED. 18 passed; 1 failed; 0 ignored; 0 measured; 0 filtered out; finished in 0.05s
The code is right and the test is wrong. The order shape is 16 reserved bytes, five 4-byte fields (20), a u16 (2) and two u8 (2): 40 in total, a multiple of 8, no padding. The test expects 48. The packing rule works; the expectation was miscalculated.
2. Os and Sealed do the same thing. The documented difference is that Sealed reaches the disk only when a segment seals. But sealing calls sync_all in every mode, and append only calls flush in every mode except Commit (and flush on a std::fs::File does nothing anyway). The result: today Durability::Os also reaches the disk at seal, and the two modes are identical. The differences in the chart above are measurement noise. This is not a data-loss bug, since Os is more durable than it promises, but if there are two settings they should behave differently. Either Os should skip the fsync at seal or the two should collapse into one.
3. A crash window in the middle of sealing. This is the real bug. roll() creates the next segment file first and seals the old one (writes its record count into the header) second. If the process dies between the two, the disk holds an old segment whose records are complete but whose header count is still zero, plus an empty new segment. open() marks a zero-count file as "replayed whatever its position", but then assigns it to the active variable, and the next file (the empty new segment) overwrites that same variable. The old segment's records end up neither in the sealed list nor in the active segment. I simulated this by appending 6 records in Commit mode and then putting segment 0's header count back to its pre-seal value of zero:
append 6 -> (0, 6)
before: Stats { records: 6, segments: 2, bytes: 368, first_seq: 0, next_seq: 6, min_ts: 1000, max_ts: 1005, appended: 6, dropped: 0 }
after:  Stats { records: 2, segments: 1, bytes: 144, first_seq: 4, next_seq: 6, min_ts: 1004, max_ts: 1005, appended: 6, dropped: 0 }
segment 0 still on disk: 224 bytes
Four fsynced, acknowledged records become invisible on reopen. The file is still on disk, so the data is not physically gone, but the engine no longer reads it. The window is narrow (between two file operations), but it is exactly where the durability promise is supposed to mean something. The fix is simple: a zero-count file that is not the last one should have its records counted from the file length and be sealed in place. It belongs to the same family as bugs I closed elsewhere in OxiDB recently: the "five acknowledged-write losses in recovery" commit just before 0.44.2 closed five ways an acknowledged write could be lost in document-engine recovery, one of which was "a zero-record torn tail swallowed every later append".
Money correctness: related CHANGELOG notes
The ledger engine is not live yet, but most of what had to be fixed before an exchange could trust OxiDB with its data is in the document engine and recorded in the CHANGELOG. These were the references in my head while designing this engine:
- v0.34.0, two writes to the same document: two writes to one document inside a transaction did not see each other;
$inc -2then$inc +1yielded +1 instead of -1. In the CHANGELOG's own words, that was "creating money in a ledger". Writes now compose, andfind_for_update(SELECT ... FOR UPDATE) was added. - fsyncgate: in group commit, a transaction applied its writes in memory and then fsynced the WAL. When the fsync failed, the commit correctly returned an error, but the rejected writes leaked into the next checkpoint: "money moved despite the API reporting failure". A failed WAL fsync now poisons in-memory state and recovery replays only acknowledged transactions.
- v0.40.0, a half-applied multi-collection transaction: a transaction spanning two collections could recover half-applied after a crash. The Jepsen-style bank test, the multi-collection atomicity drill and the exactly-once test all failed on that one bug.
- The exchange readiness table: sequence and trade-ID monotonicity across Raft leader failover (
raft_sequence_monotonic), exactly-once application under retry (exactly_once), an order fill being all-or-nothing across five collections (multi_collection_crash).
The ledger's rules, "the engine assigns the sequence" and "an acknowledgement means on disk", follow directly from those lessons. The third finding above shows that the same discipline has not been fully applied to this new crate yet.
Limits and trade-offs
- Not in the server. No wire command, no client library, no REST endpoint. Today it is usable only embedded, from Rust, and even then you have to write a
lib.rsfor it. - No query layer. The predicate evaluator, projection and aggregation API are not written; today you walk
segments()yourself. - Fixed schema. Adding, removing or widening a field means a new stream. No text or variable-length fields (even field names are 12 bytes).
- Everything is
i64.u64values abovei64::MAXread negative. - Retention is per segment. Some records older than the cutoff may survive for up to a segment; a quiet stream's active segment is never dropped.
- Single writer.
appendtakes&mut self; the concurrency model (one writer per stream, many readers) will be designed together with the wire layer. - No replication. It is not attached to the Raft cluster; the replication and sequence guarantees the document engine has do not exist here yet.
- The crash window and the
Os/Sealedsameness described above are open.
How it fits with the rest of OxiDB
This is how I see its place: the balance ledger and the double-entry journal stay in the document engine with transactions, because they need isolation (document engine). Order and fill journals go to the ledger, because they need order, durability and retention. Candles and market data live in the time series engine, reporting in the SQL engine, and fill events fan out over MQTT and AMQP. The comment in the source says the same thing: fills are "also on the wire, in the browser, and in the time series", which is why a fill journal may not want Commit.
The resemblance to the time series engine is obvious, but the goals differ: the time series engine is built around flexible tags and compression; the ledger around engine-assigned dense sequences, zero encoding, and an fsync that means an acknowledgement.
What is next, and how to try it
First, fix the three things this post turned up: the test, Os mode and the sealing window. Then bring the crate into the workspace, give it a lib.rs and a query layer, and most importantly the wire surface: an append command with no parsing, where the client sends records in exactly the bytes that will hit the disk. After that the ledger can be switched on with an environment variable like the other engines in this series.
Until then, to try the OxiDB that runs today, releases are on the GitHub releases page with binaries for macOS (arm64/x86_64), Linux (x86_64/arm64) and Windows, and docker compose up -d in the repo brings it up in Docker. The ledger crate lives in the source under oxidb-ledger/; with the #[path] trick above you can mount it into your own project and run its tests in five minutes. The last post in the series covers the recommendation engine.